- The Zscaler Experience
Your world, secured
Experience the transformative power of zero trust.
Zscaler: A Leader in the 2023 Gartner® Magic Quadrant™ for Security Service Edge (SSE)
Get the full report
![gartner magic quadrant gartner magic quadrant]()
Zero Trust Fundamentals
-
What is Zero Trust?
-
What is Security Service Edge (SSE)?
-
What is Secure Access Service Edge (SASE)?
-
What is Zero Trust Network Access (ZTNA)?
-
What is Secure Web Gateway (SWG)?
-
What is Cloud Access Security Broker (CASB)?
-
What is a Cloud Native Application Protection Platform (CNAPP)?
-
Zero Trust Resources
-
- Products & Solutions
![test test]()
Secure Your Users
Provide users with seamless, secure, reliable access to applications and data.
![test test]()
Secure Your Workloads
Build and run secure cloud apps, enable zero trust cloud connectivity, and protect workloads from data center to cloud.
![test test]()
Secure Your IoT and OT
Provide zero trust connectivity for IoT and OT devices and secure remote access to OT systems.
Products
Transform your organization with 100% cloud native services
Solution Areas
Propel your business with zero trust solutions that secure and connect your resources
-
Cyberthreat Protection
-
Data Protection
-
Zero Trust Networking
-
Business Analytics
-
VPN Alternative
-
Zero Trust SASE
-
Accelerate M&A Integration
-
Optimize Digital Experiences
-
Zero Trust SD-WAN
-
Zero Trust Cloud Connectivity
-
Zero Trust for IoT/OT
-
Find a product or solution
-
Find a product or solution
-
Partner Integrations
Industry and Market Solutions
-
- Platform
Zero Trust Exchange Platform
Learn how Zscaler delivers zero trust with a cloud native platform built on the world’s largest security cloud.
![test test]()
Transform with Zero Trust Architecture
Propel your transformation journey
Secure Your Business Goals
Achieve your business and IT initiatives
- Resources
Learn, connect, and get support.
Explore tools and resources to accelerate your transformation and secure your world
![CXO REvolutionaries CXO REvolutionaries]()
Amplifying the voices of real-world digital and zero trust pioneers
Visit now
Resource Center
Stay up to date on best practices
Events & Trainings
Find programs, certifications, and events
Security Research & Services
Get research and insights at your fingertips
Tools
Tools designed for you
Community & Support
Connect and find support
Industry & Market Solutions
See solutions for your industry and country
- Company
Discover how it began and where it’s going
Meet our partners and explore system integrators and technology alliances
Stay up to date with the latest news
Meet our management team
Explore best-in-class partner integrations to help you accelerate digital transformation
See news, stock information, and quarterly reports
Learn about our ESG approach
Join our mission
Find everything you need to cover Zscaler
Understand our adherence to rigorous standards
Understand our adherence to rigorous standards
Global Enforcement Dashboard
Inside the world's largest security platform built for the cloud
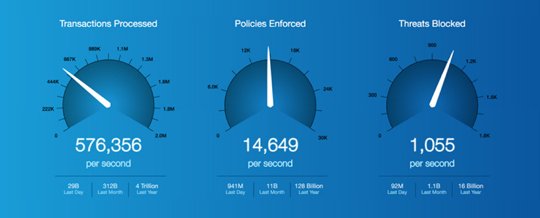
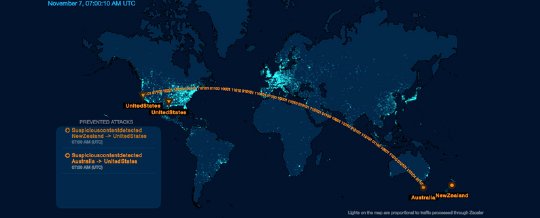
Zscaler: now blocking threats and enforcing policies in a cloud near you.
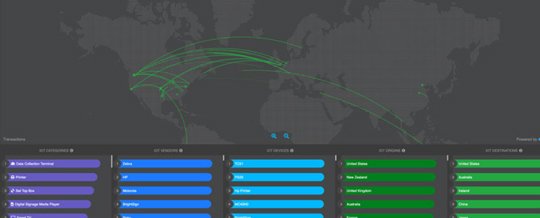
With Zscaler, all internet traffic is routed through the Zscaler cloud data center nearest the user, one of more than 100 globally. Every byte of the traffic is analyzed before it goes out to the open internet and before it is routed back to the user, all with near-zero latency.
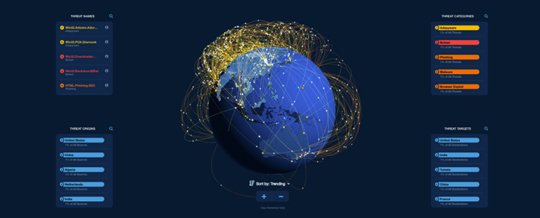
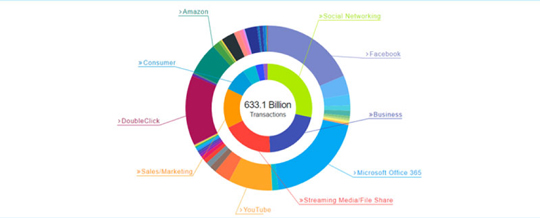
This dashboard provides a graphical view of the hourly activity in the Zscaler cloud. By selecting one of the three buttons to the left of the globe, you can see where the most transactions are originating, where most threats are being blocked, and where policies are being enforced. The map is updated hourly.
About ThreatLabZ
ThreatLabZ is the embedded research team at Zscaler. This global team includes security experts, researchers, and network engineers responsible for analyzing and eliminating threats across the Zscaler security cloud and investigating the global threat landscape. The team shares its research and cloud data with the industry at large to help promote a safer internet.


How secure are you?
Check your security with our instant risk assessment, Security Preview. It’s free, confidential and safe. 85% of companies who run this test find vulnerabilities that require immediate attention.
Suggested Resources

2023 Gartner Magic Quadrant for Security Service Edge
Get the report
Office 365 is all the rage - but is your network ready?
Watch the webcast
Secure digital business transformation
Watch the webcast


