Zscaler 블로그
Zscaler 블로그의 최신 업데이트를 이메일로 받아보세요
LinkedIn Outage Detected by Zscaler Digital Experience (ZDX)

At 3:40 p.m. EST on March 6, 2024, Zscaler Digital Experience (ZDX) saw a substantial, unexpected drop in the ZDX score for LinkedIn services around the globe. Upon analysis, we noticed HTTP 503 errors highlighting a LinkedIn outage, with the ZDX heatmap clearly detailing the impact at a global scale.
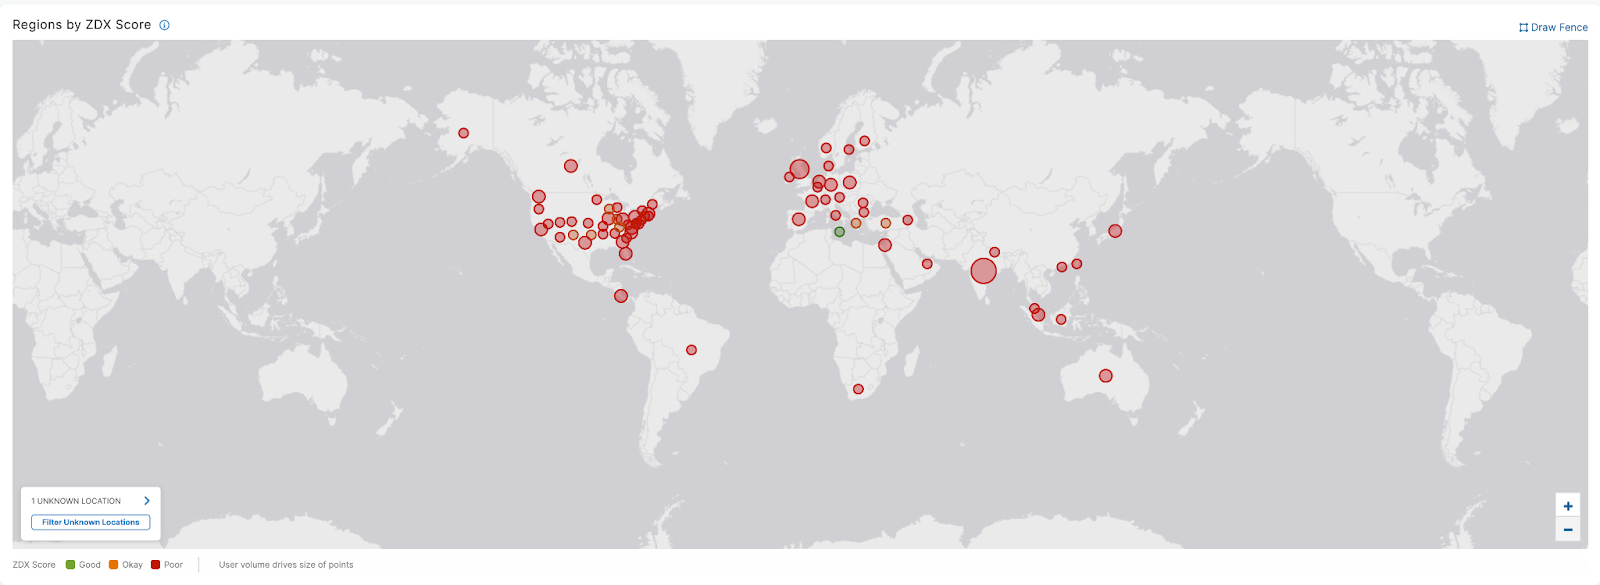
ZDX dashboard indicating widespread LinkedIn outage
ZDX enables customers to proactively identify and quickly isolate service issues, giving IT teams confidence in the root cause, reducing mean time to resolve (MTTR) and first response time (MTTD).
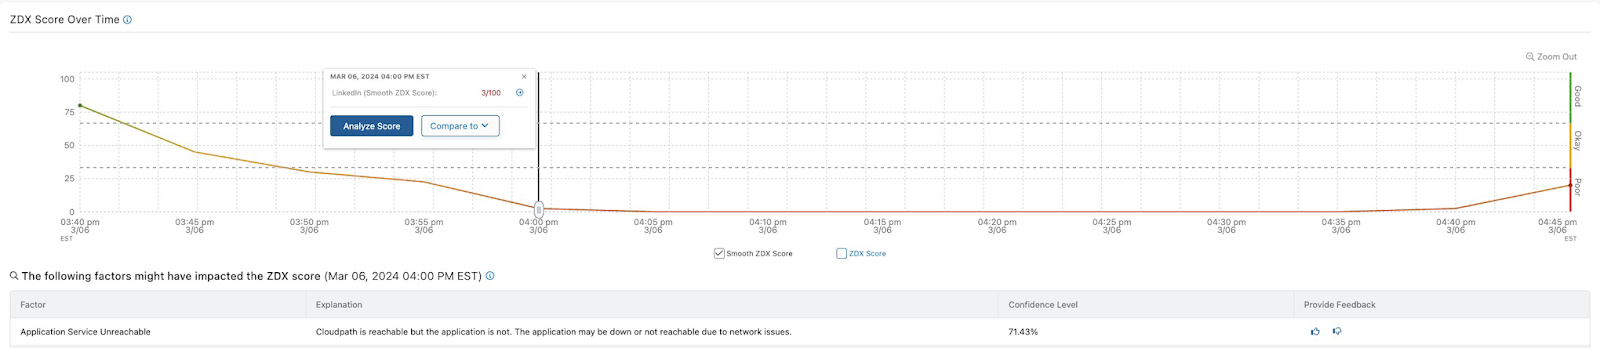
ZDX dashboard showing LinkedIn global issues
ZDX Score highlights LinkedIn outage
Visible on the ZDX admin portal dashboard, the ZDX Score represents all users in an organization across all applications, locations, and cities on a scale of 0 to 100, with the low end indicating a poor user experience. Depending on the time period and filters selected in the dashboard, the score will adjust accordingly.
The dashboard shows that the ZDX Score for the LinkedIn probes dropped to ZERO during the outage window of approximately 1 hour. From within ZDX, service desk teams can easily see that the service degradation isn’t limited to a single location or user and quickly begin analyzing the root cause.
ZDX Score indicating LinkedIn outage and recovery (times in EST)
Also in the ZDX dashboard, “Web Probe Metrics” highlight the user impact of reaching LinkedIn applications across a timeline with response times. In this case, the server responded with 503 errors, indicating the server was not ready to handle requests.
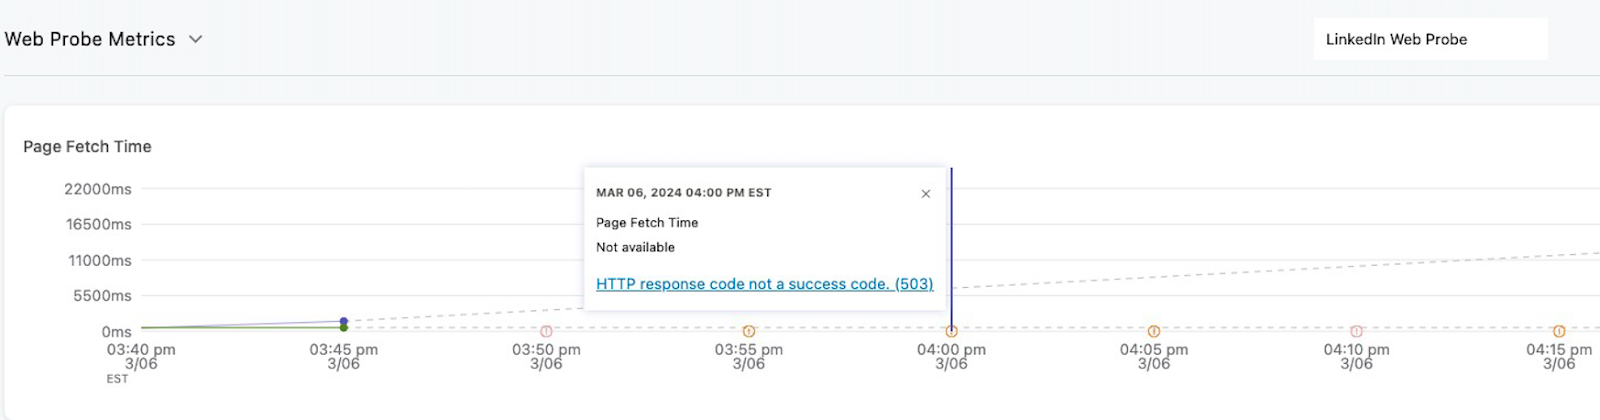
ZDX Web Probe Metrics indicating 503 errors (times in EST)
ZDX can quickly identify the root cause of user experience issues with its new AI-powered root cause analysis capability. This spares IT teams the labor of sifting through fragmented data and troubleshooting, thereby accelerating resolution and keeping employees productive.
With a simple click in the ZDX dashboard, you can analyze a score, and ZDX will provide insight into potential issues. As you can see, in the case of this LinkedIn outage, ZDX highlights that the application is impacted while the network itself is fine.

ZDX AI-powered root cause analysis indicates the reason for the outage
When there’s an application outage, many IT teams turn to the network as the root cause. However, as you can see above, ZDX AI-powered root cause analysis verified that the network transport wasn’t the issue; it was actually at the application level. You can verify this by looking at the CloudPath metrics from the user to the destination.
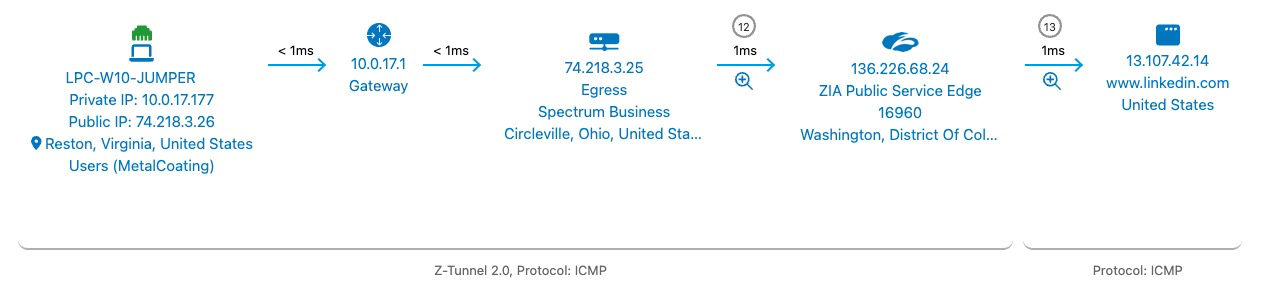
ZDX CloudPath showing full end-to-end data path
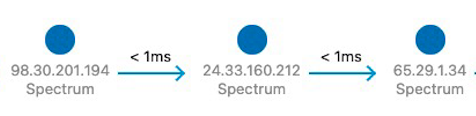
ZDX CloudPath detailed hops between the nodes
With AI-powered analysis and dynamic alerts, IT teams can quickly compare optimal vs. degraded user experiences and set intelligent alerts based on deviations in observed metrics. ZDX allows you to compare two points in time to understand the differences between them. This function determines a good vs. poor user experience, visually highlighting the differences between application, network, and device metrics.
The end user comparison during the LinkedIn outage vs. a known good score indicates the ZDX Score difference, highlighting the unexpected performance drop for the end user.
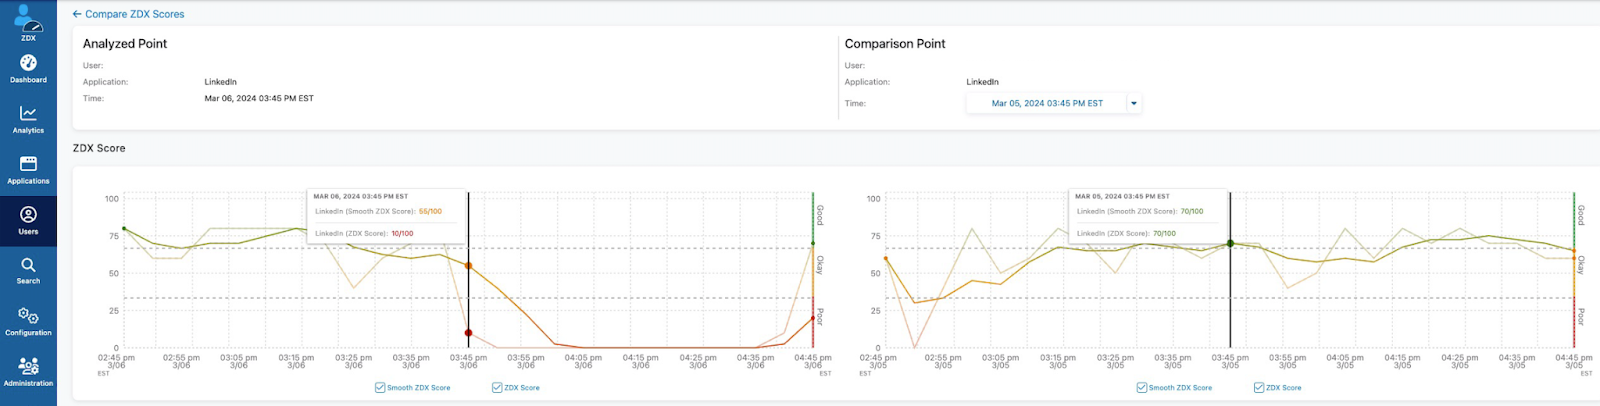
ZDX comparison mode identifies the change in user experience
According to the LinkedIn status page, the outage was reported at 12:50 PST until 14:05 PST, which correlates to the ZDX data above. However, LinkedIn services started to recover pretty quickly, by 13:40 PST, and LinkedIn reported the issue resolved by 14:05 PST.
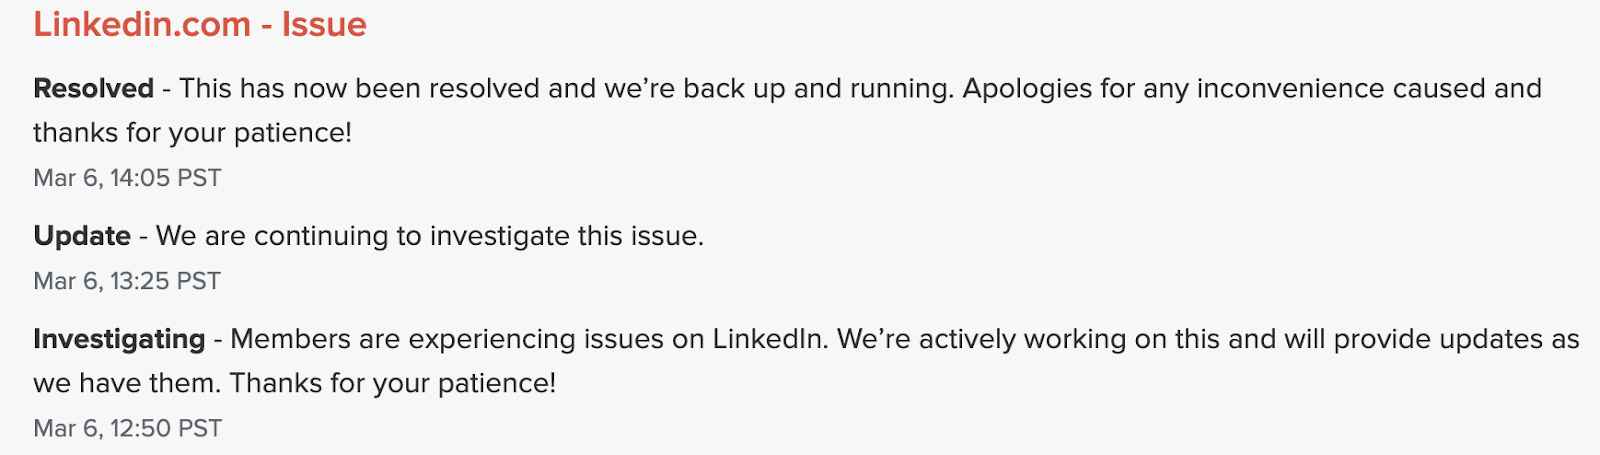
Source: LinkedIn
With ZDX alerting, our customers were proactively notified about end user problems, and incidents were opened automatically with our service desk integration (e.g., ServiceNow) long before users started to report it. From a single dashboard, customers were able to quickly identify this as a LinkedIn issue, not an internal network outage, saving precious IT time.
Zscaler Digital Experience successfully detected a LinkedIn outage along with its root cause, giving our customers the confidence that it was not a single location, their networks, or devices, averting critical impact to their business.
Try Zscaler Digital Experience today
ZDX helps IT teams monitor digital experiences from the end user perspective to optimize performance and rapidly fix offending application, network, and device issues. To see how ZDX can help your organization, please contact us.

이 게시물이 도움이 되었나요?


면책 조항: 이 블로그 게시물은 정보 제공만을 목적으로 Zscaler에서 작성하였으며, 정확성, 완전성 또는 신뢰성에 대한 어떠한 보증도 없이 "있는 그대로" 제공됩니다. Zscaler는 제공된 정보를 기반으로 수행된 조치나 오류 또는 누락에 대해 어떠한 책임도 지지 않습니다. 이 블로그 게시물에 링크된 제3자 웹사이트나 리소스는 편의를 위해서만 제공되며, Zscaler는 해당 웹사이트의 콘텐츠나 관행에 대해 책임을 지지 않습니다. 모든 콘텐츠는 예고 없이 변경될 수 있습니다. 이 블로그에 접속함으로써 귀하는 본 약관에 동의하며 귀하의 필요에 따라 정보를 확인하고 사용할 전적인 책임이 귀하에게 있음을 인정합니다.


