Zscaler Digital Experience detects outage
At 6:30 a.m. (GMT +530) on July 21, 2022, Zscaler’s Digital Experience (ZDX) monitoring solution saw a substantial unexpected drop in the ZDX score for M365 services across the globe. Upon further analysis, we noticed packet drops in M365 contributing to a drastic decline in the ZDX Score signaling an M365 outage. The ZDX heatmap clearly details the impact of the outage at a global scale, which provided one of our customers the confidence to shift to another meeting solution, and avoid business disruption. Additionally, some of our customers utilize the ITSM integration with ZDX, where automatic tickets were created with all the details about the issue before Microsoft globally acknowledged the outage. This way, any reactive tickets getting opened would already have the resolution, thereby not impacting mean time to resolve (MTTR) and first response time (FRT).
AI-powered analysis identifies root cause of global outage
In further analysis, you can see the ZDX Score for the Microsoft Teams application drops to zero for approximately two hours. From within ZDX, service desk teams can easily see that the outage is not a single location or a single user, and get to root cause analysis quickly.
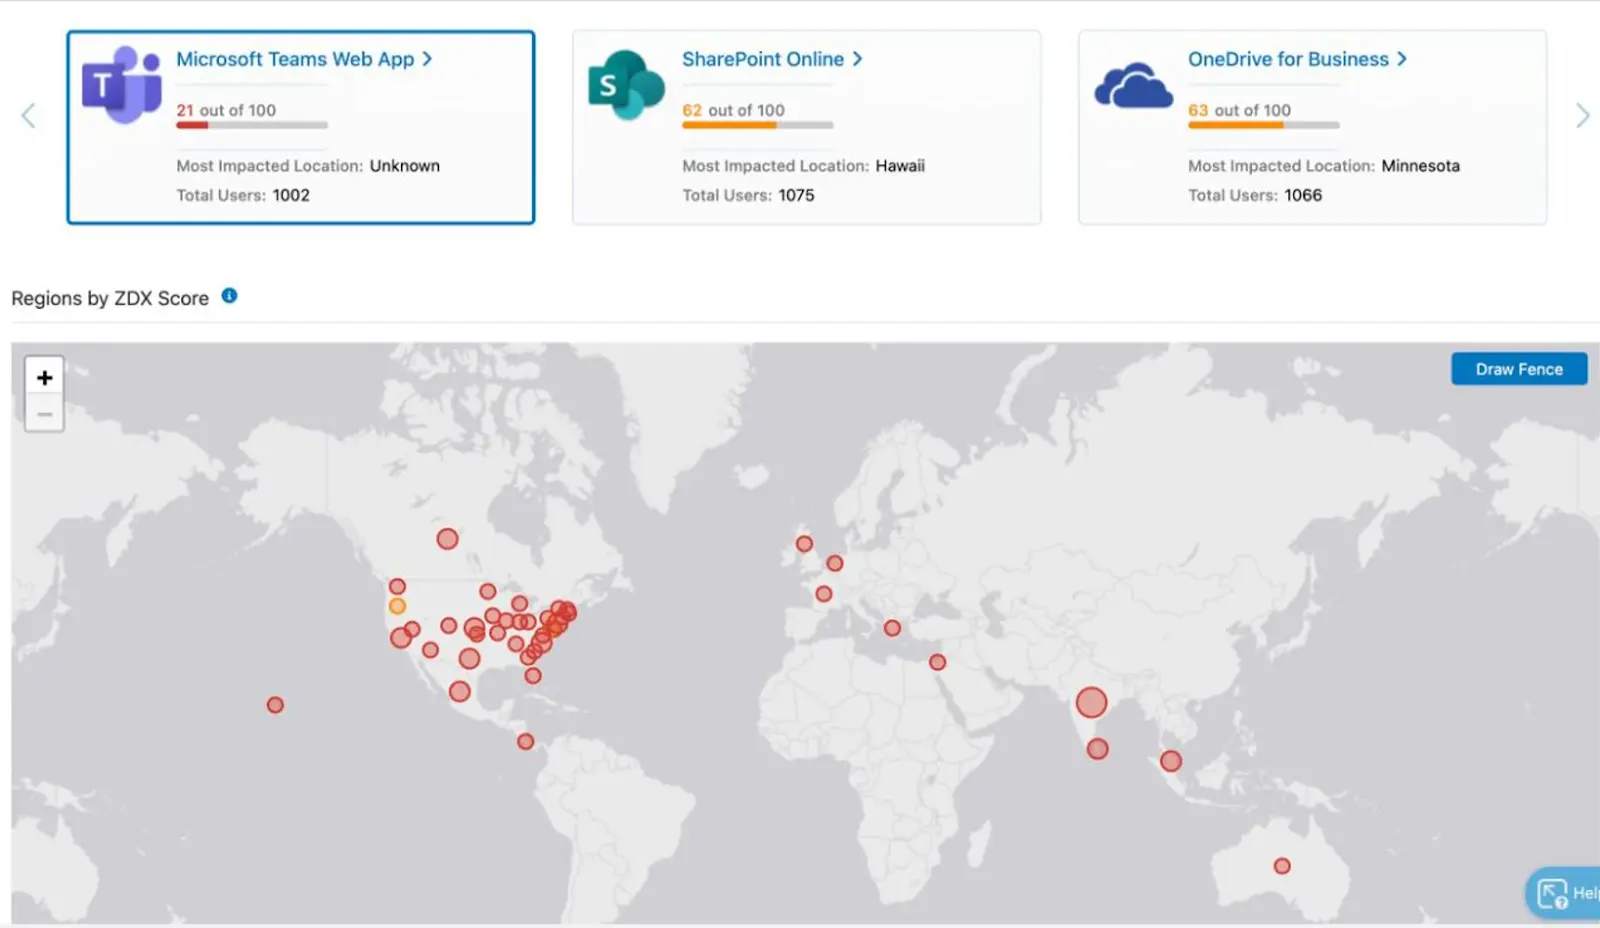
Zscaler’s Digital Experience Monitoring Dashboard Showing M365 Global Outage
ZDX recently announced an AI-powered root cause analysis capability to automatically identify root causes of performance issues. The goal is to reduce troubleshooting time, eliminate finger-pointing, and get users back to work faster. In this case, the capability delivered.
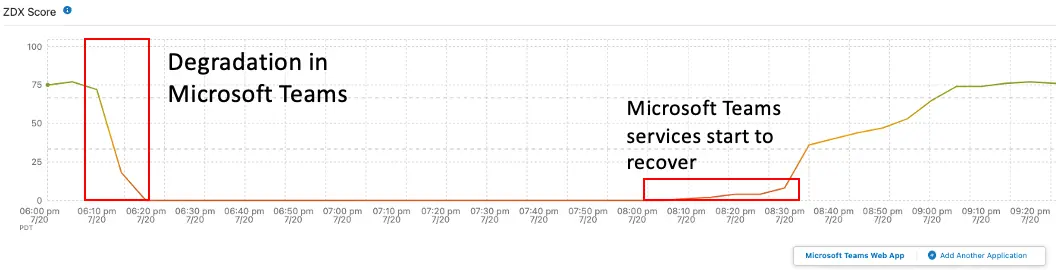
Just select a point in time and click on ‘Analyze Score.’ ZDX leverages AI-powered analysis to correlate data points and provide insights instead of manually sifting through the dashboard. Think of it as the easy button for IT teams.
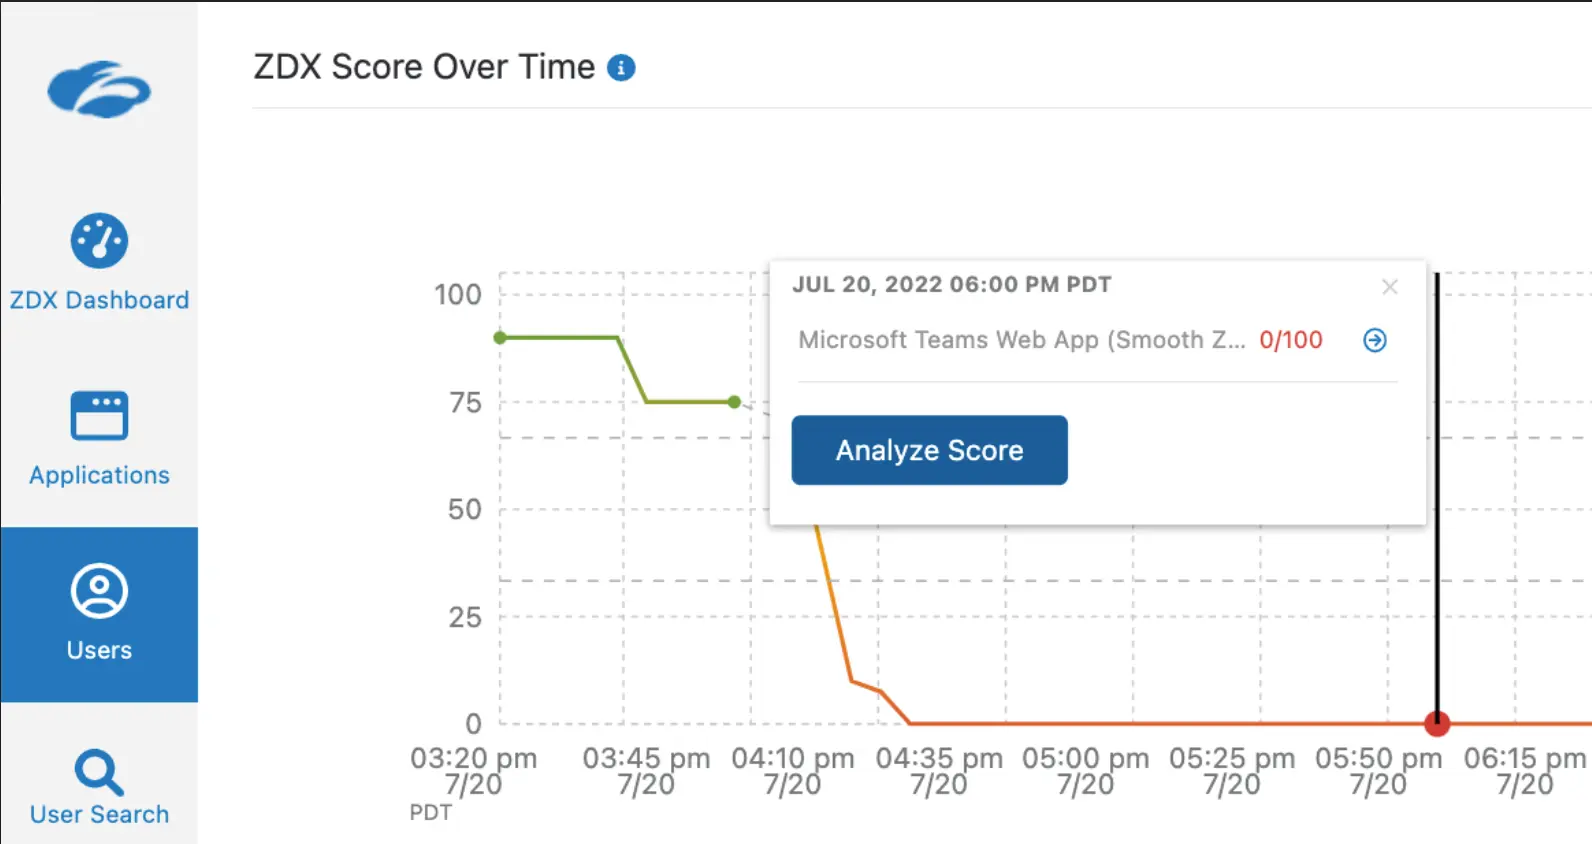
ZDX Score with AI-powered Root Cause Analysis
Once you click on the ‘Analyze Score’ button, you will see explanations of what happened. It only takes a few seconds and reduces the amount of time you have to troubleshoot. The root causes analysis identifies that Microsoft Teams availability is impacted.

ZDX Score with AI-powered Root Cause Analysis
In the ZDX dashboard, you will also see ‘Web Probe Metrics,’ which highlight the impact of reaching the Microsoft Teams application across a timeline with response times. In this case, the response times drop to 0.
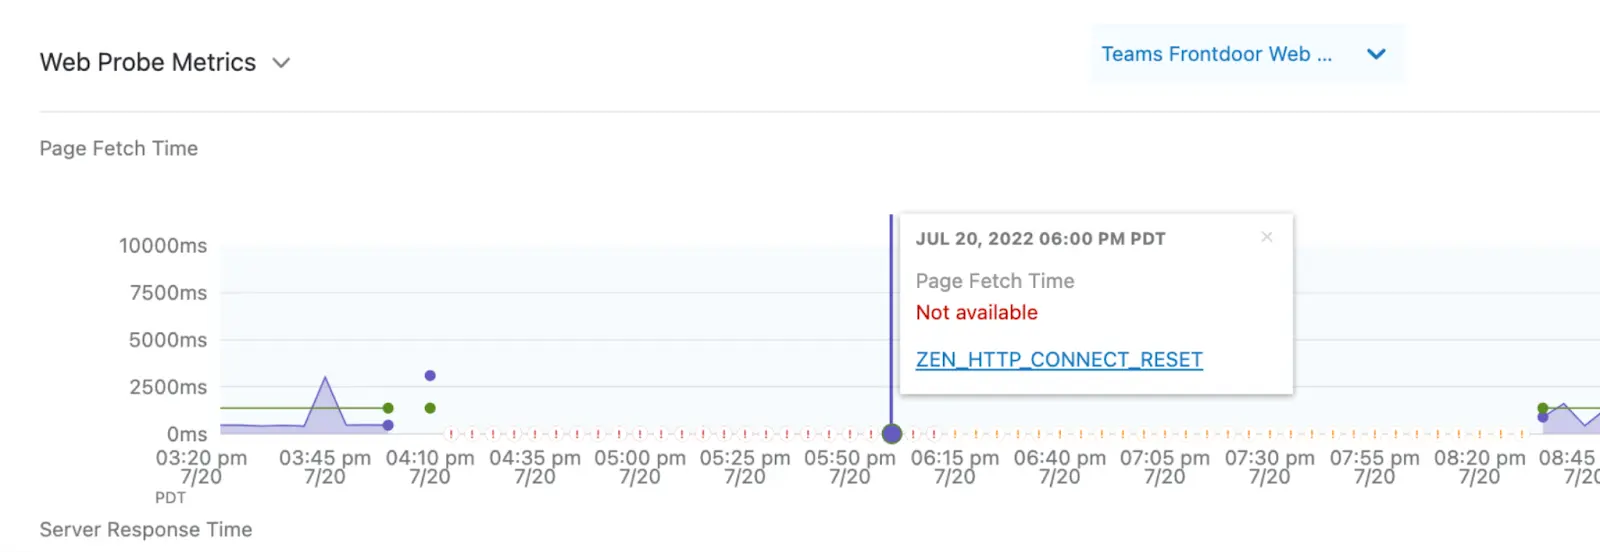
ZDX Web Probe Metrics
Once you understand that the impact is global, it’s critical to focus on areas most impacted, especially based on the time of the outage. Since this was during the night for North America and EMEA, regions such as India would be a key focus area. ZDX allows you to drill into the ZDX Score at a regional level and gather the number of users impacted.
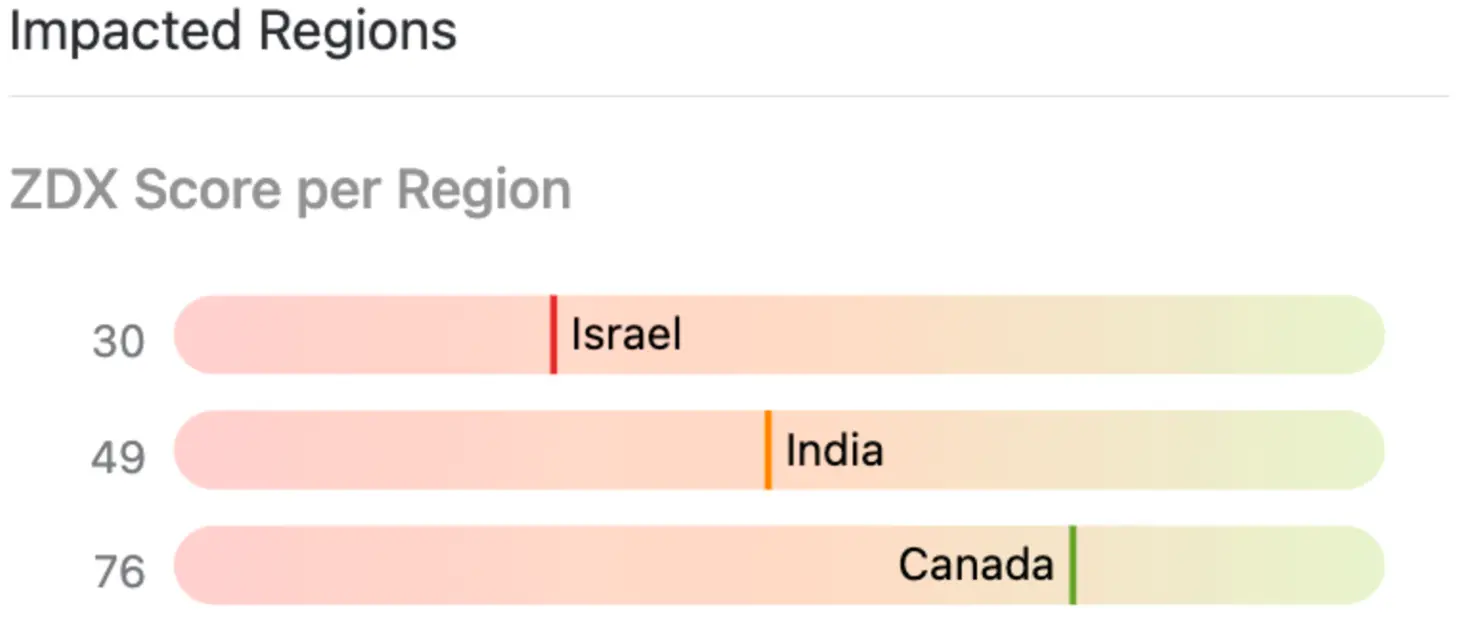
ZDX Score by Region
As you can see by this example, drilling into India, almost 2K+ users were having an ‘okay’ to ‘poor’ experience. If it’s not caught early enough, this could severely impact service desk teams with outage notifications, causing costly escalations.
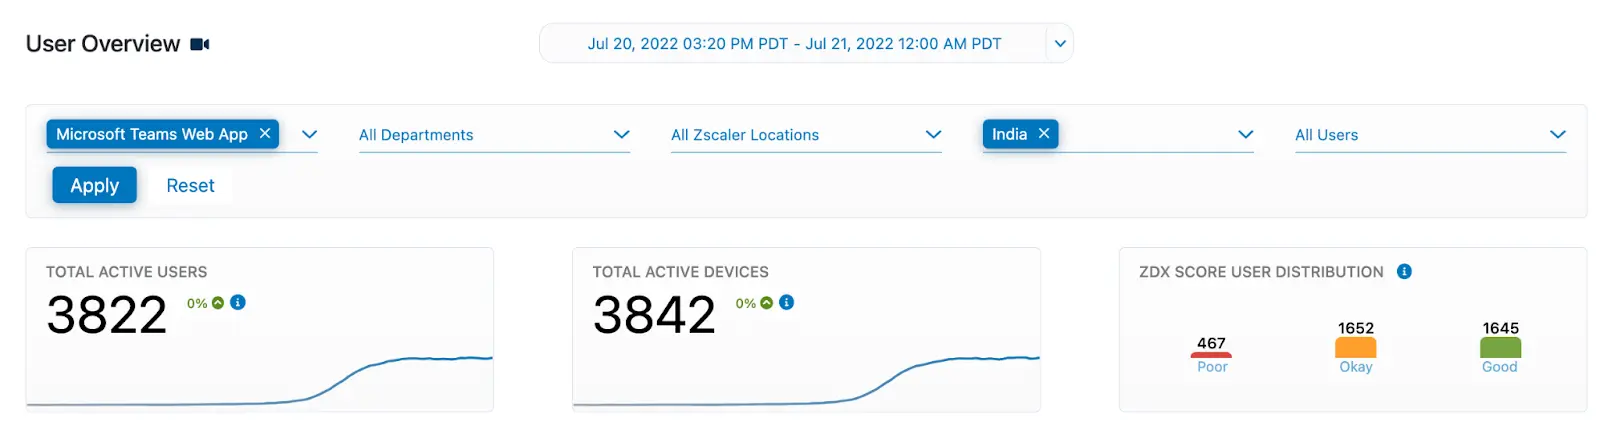
ZDX User Overview
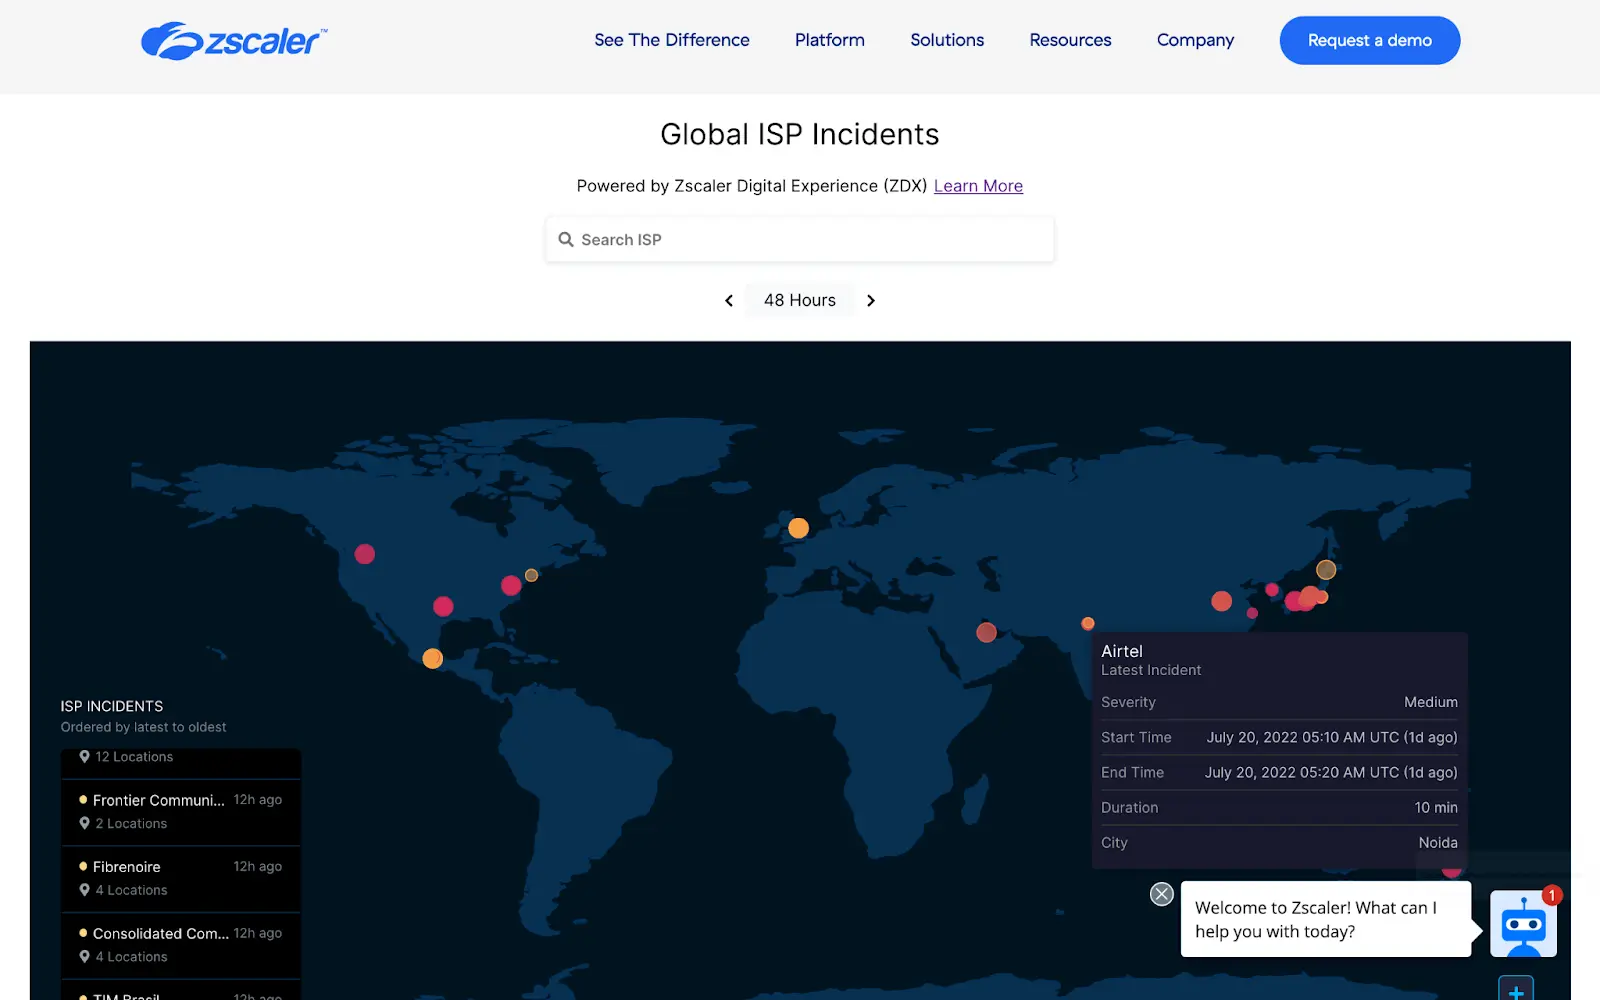
As we realize the impact is across multiple users, it’s always a good idea to check if there is an Internet Service Provider (ISP) issue. ZDX ISP Insights is an easy-to-leverage site to display ISP outages across a global map. As you can see, there isn’t a global ISP issue.
Microsoft did acknowledge that an outage occurred on Twitter stating “a recent deployment contained a broken connection to an internal storage service, which has resulted in impact.”
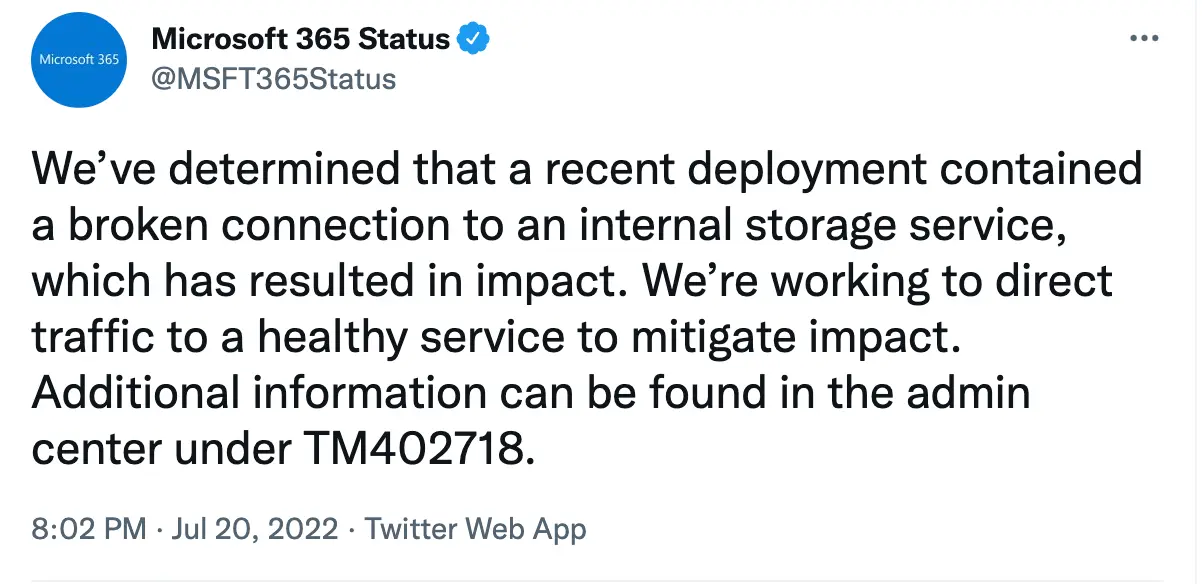
Source: Twitter.com
Zscaler Digital Experience successfully detected an M365 outage, along with its root cause, giving our customer the confidence they needed to temporarily switch meeting solutions, averting critical impact to their business.
Try Zscaler Digital Experience today
ZDX helps IT teams monitor digital experiences from the end user perspective to optimize performance and to rapidly fix offending application, network, and device issues. To see how ZDX can help your organization, please contact us.