Zscaler 블로그
Zscaler 블로그의 최신 업데이트를 이메일로 받아보세요
Navigating Data Security with Innovative Data Discovery Dashboard

Introduction
In an era where data is the new gold, safeguarding it against potential threats and breaches is paramount. IT administrators often struggle with enormous amounts of data, trying to discern patterns, anomalies, or identify potential threats. Organizations want control and visibility over its environment, where employees access hundreds of sanctioned and unsanctioned cloud applications for everyday work. This is where our next-gen, ML-powered Data Discovery Dashboard, meticulously designed for customers like you, comes in to streamline the process by offering a nimble and efficient approach to data protection.
Harnessing the Power of Data Visualization and AI/ML in Data Security
Data visualization is not merely a presentation tool but a lens through which complex data is transformed into understandable, accessible, and usable information. The Data Discovery Dashboard goes a step further, integrating innovative visualizations to:
- Enhance Visibility: Visibility is the starting point of any data protection plan. You can’t protect what you cannot see. Unless you have visibility into the “what, where, and how” of your applications and data, you cannot implement a strong data protection program. Visibility covers a big spectrum of use cases to make sure you do not have any blind spots. Data discovery dashboard enhances visibility into sensitive data at rest in sanctioned and unsanctioned cloud applications and user activity.
- Discover Data quickly with Power of ML: Zscaler inspects 170 million files every day. This anonymized data gets fed to the AI/ML classification engine for continuous learning and improved accuracy.
- Spot Trends and Anomalies: User-centered and innovative visuals enable IT administrators to quickly identify patterns and outliers that might indicate a potential security threat.
- Immediate Action: With data neatly visualized, IT admins can rapidly pinpoint issues and mobilize corrective actions without sifting through raw scattered data.
- User-friendly Interface: The dashboard is meticulously designed with user experience (UX) in mind, ensuring ease of navigation, interpretation and operation in the most simplified way.
Understanding the Data Discovery Dashboard
Our Data Discovery Dashboard is intuitively designed to cater to both seasoned security professionals and those newer to the realm of data security.
The Spider-Diagram Data Visualization:
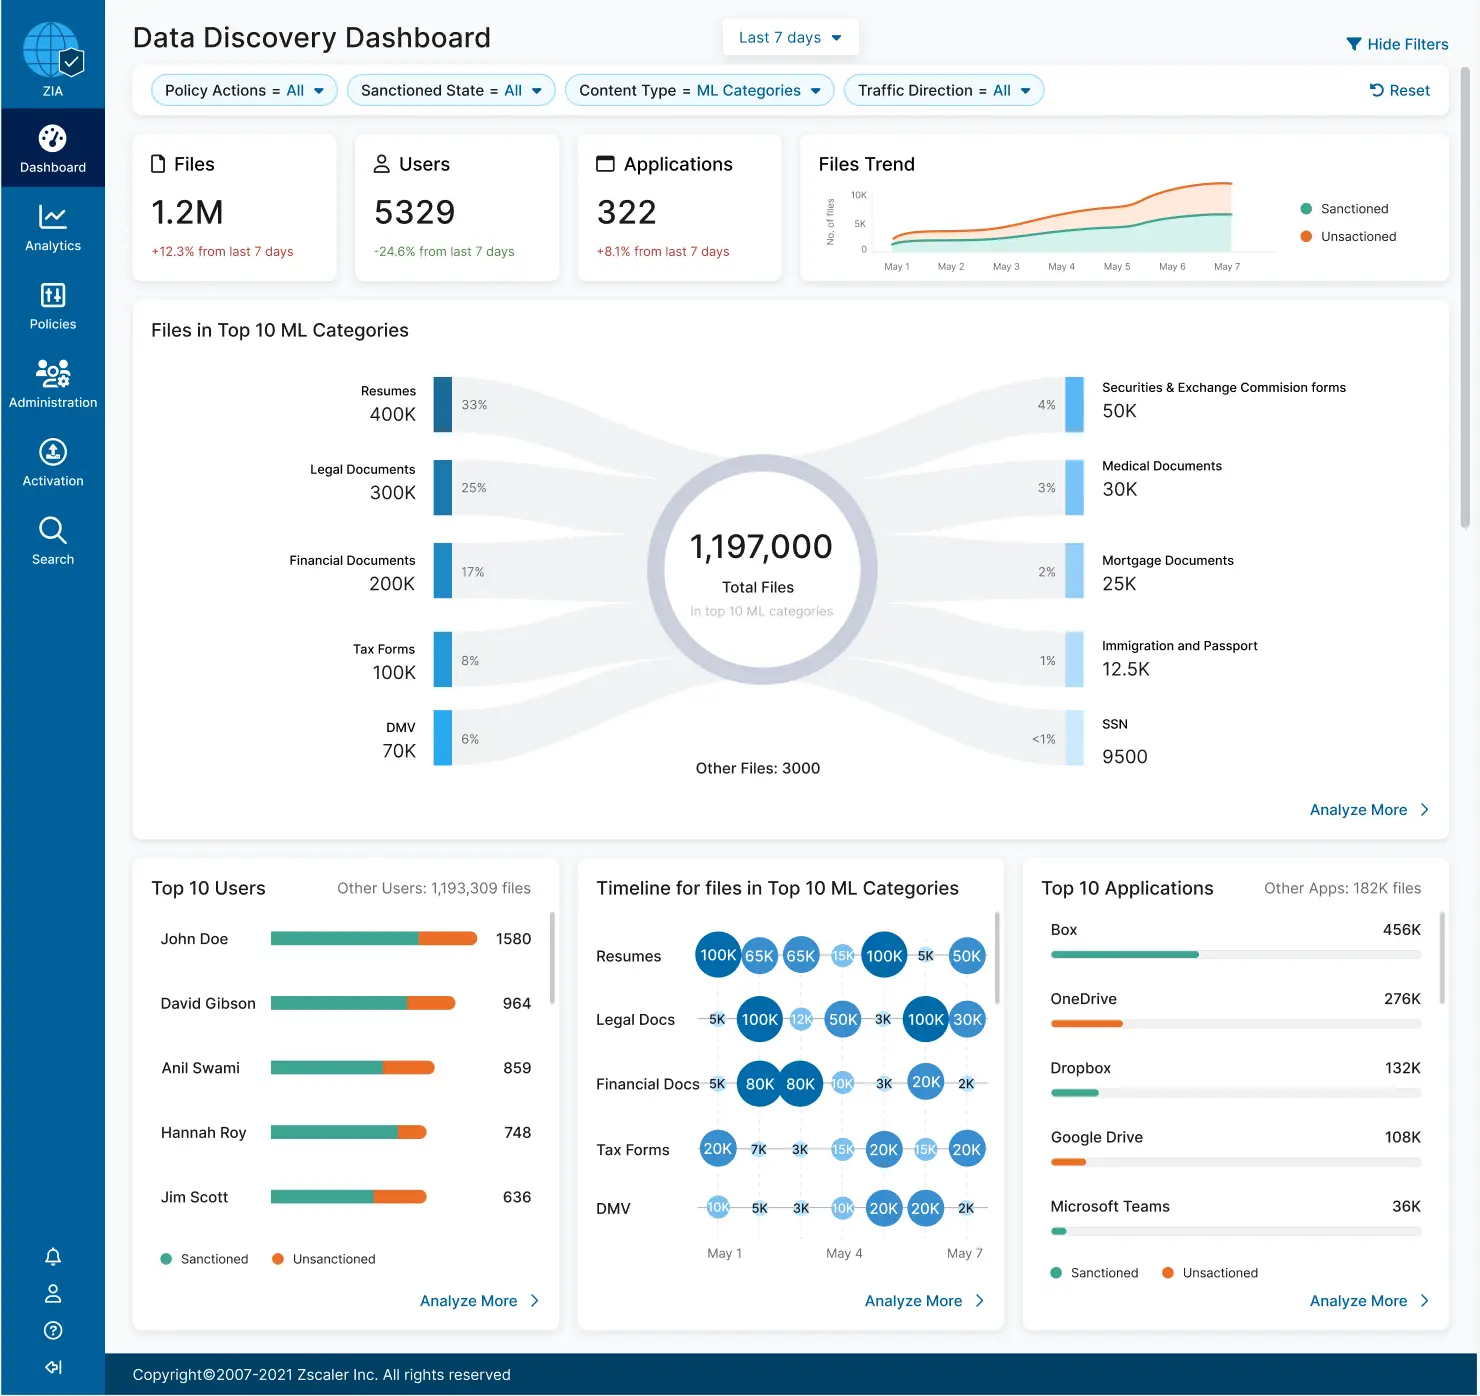
As admins log into the zero configuration Data Discovery dashboard, by default it represents the front and center ‘spider-diagram’ with the total amount of files inspected in the center and ten arms extended to left and right side representing the distribution of files into auto-discovered, auto-classified document categories. As shown in the image below, the admin quickly gets complete visibility over all the real-time, sensitive data such as litigation documents, financial documents, medical documents and immigration documents, to name a few. Every data point in this part-to-whole data visualization is readily available to them without setting a single policy, rule, and criteria.
Summary Charts:
The top portion of the page allows you to select the time range for which you want to view the data and various filters to focus on specific data points. High-level stats for Total number of Files, Users, and Applications provide an overview of the key elements of the environment. Files Trend provides a quick progression of file accumulation over a period of time for both sanctioned and unsanctioned cloud applications.
Top Contributors:
Lastly as you dig deeper towards the bottom of the page, widgets answer the questions:
- Who are the top users that are contributing to this risk?
- What’s the timeline of document upload and download for all 10 document categories?
- Which are the top contributing applications that contain this data?
Delving Deeper with the Unique Drill-Down Page:
Whilst navigating through the waves of intricate data, admins often need to delve deeper to untangle the threads of potential data security issues. Our Data Discovery Dashboard seamlessly integrates a unique drill-down feature, ensuring that a more detailed analysis is just a click away.
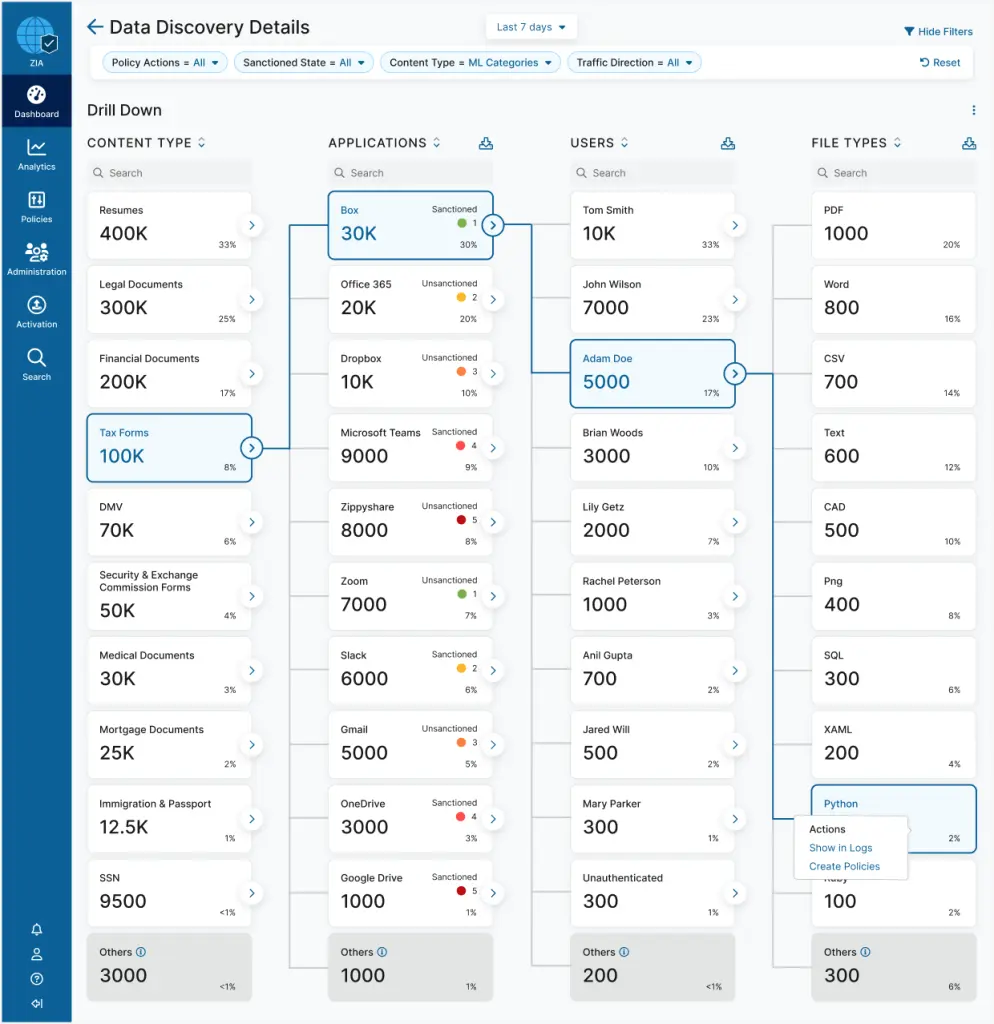
- Analyze more, seamlessly: By clicking on the 'Analyze More' button, users are ushered into a detailed page that provides a more granular view of the data, allowing for a thorough, step-by-step analysis without being overwhelming.
- Intuitive navigation: Designed with user-centric principles, the drill-down page ensures that users can easily slice the data into chunks, with visualizations and layouts that promote progressive disclosure, clarity and systematic understanding of the relationships between data sets.
- In-depth analysis with context: The drill-down page is about structured comprehension and carving a drill-down path on each click makes analysis insightful and actionable. Users can explore specifics, trace anomalies back to their source, and find the needle in the haystack within three clicks without losing the context and full picture of data.
- Customizable views for targeted analysis: Users can customize the drill-down view to focus on aspects most relevant to their analysis, ensuring that the detailed exploration is always aligned with their objectives. They can customize the column order to change the anchor points of investigation. Eg., an admin can start with the Users column and then drill-down to Applications for a specific user, then File Types for that application and lastly, Content Types for selected file type.
- Actionable insights: The drill-down page is not just a repository of information but a tool that provides actionable insights. It is meticulously crafted to ensure that deeper analysis translates into actions, enabling admins to make informed decisions and strategize effectively. For each drill-down path, admins can create a policy to block the malicious activity instantly.
In an environment where every second counts, the ability to swiftly and effortlessly transition from a broad overview to a detailed analysis to remediation is invaluable. The detailed view is a gateway to a realm where data tells its story in a manner that is comprehensive yet concise, detailed yet not overwhelming, ensuring that you are always in command of your data security narrative.
Empowering Decision-Making with Data
Security administrators can leverage the dashboard to make data-driven decisions with confidence, thanks to:
- Real-time data: Get up-to-the-minute data to ensure that your security decisions are timely and relevant.
- Efficient analysis: Explore past data to understand trends, anticipate potential future threats, and fortify data security protocols.
- Customizable views: Tailor the dashboard to your specific needs, focusing on the data most pertinent to your security management.
Conclusion
In a nutshell, Data Discovery workflow answers four important questions in no time:
- Where is my data?
- Is it sensitive?
- Who can access it?
- Can I enforce consistent policies?
In the complex and ever-evolving landscape of data security, the Data Discovery Dashboard stands out as a canvas of clarity, guiding administrators through the multifaceted realms of data with ease and precision. Automated classification and harnessing the power of ML makes DLP work for our customers as opposed to customers working for DLP. Our commitment to providing innovative solutions ensures that you, our valued customers and users, are always a step ahead in your data protection endeavor.
The Wall Street Journal article featured this dashboard as one of the innovative and modern interfaces in the cybersecurity world. As a UX Designer, this is a proud moment for me and our team.
Ready to transform your approach to data protection?
Embark on a journey where data protection is not a cumbersome task but a streamlined, intuitive, and efficient process with our Data Discovery Dashboard. To learn more, visit our website.

이 게시물이 도움이 되었나요?


면책 조항: 이 블로그 게시물은 정보 제공만을 목적으로 Zscaler에서 작성하였으며, 정확성, 완전성 또는 신뢰성에 대한 어떠한 보증도 없이 "있는 그대로" 제공됩니다. Zscaler는 제공된 정보를 기반으로 수행된 조치나 오류 또는 누락에 대해 어떠한 책임도 지지 않습니다. 이 블로그 게시물에 링크된 제3자 웹사이트나 리소스는 편의를 위해서만 제공되며, Zscaler는 해당 웹사이트의 콘텐츠나 관행에 대해 책임을 지지 않습니다. 모든 콘텐츠는 예고 없이 변경될 수 있습니다. 이 블로그에 접속함으로써 귀하는 본 약관에 동의하며 귀하의 필요에 따라 정보를 확인하고 사용할 전적인 책임이 귀하에게 있음을 인정합니다.


