
On August 26, 2024, at 12:20 p.m. PDT, Zscaler Digital Experience (ZDX) detected a significant and sudden decline in the ZDX Score for ServiceNow services worldwide. Our analysis revealed elevated page fetch times, indicating a ServiceNow outage. The ZDX heatmap vividly illustrated the global extent of the impact. This observation aligns with the community post on ServiceNow.
ZDX effectively identified a ServiceNow outage and its underlying cause, reassuring our customers that the issue was neither localized to a single area nor related to their networks or devices, preventing significant business disruption.
“Failures are inevitable in any large-scale system. What matters is how quickly and effectively we can detect and remediate these failures.”
—James Hamilton, SVP & Distinguished Engineer, AWS
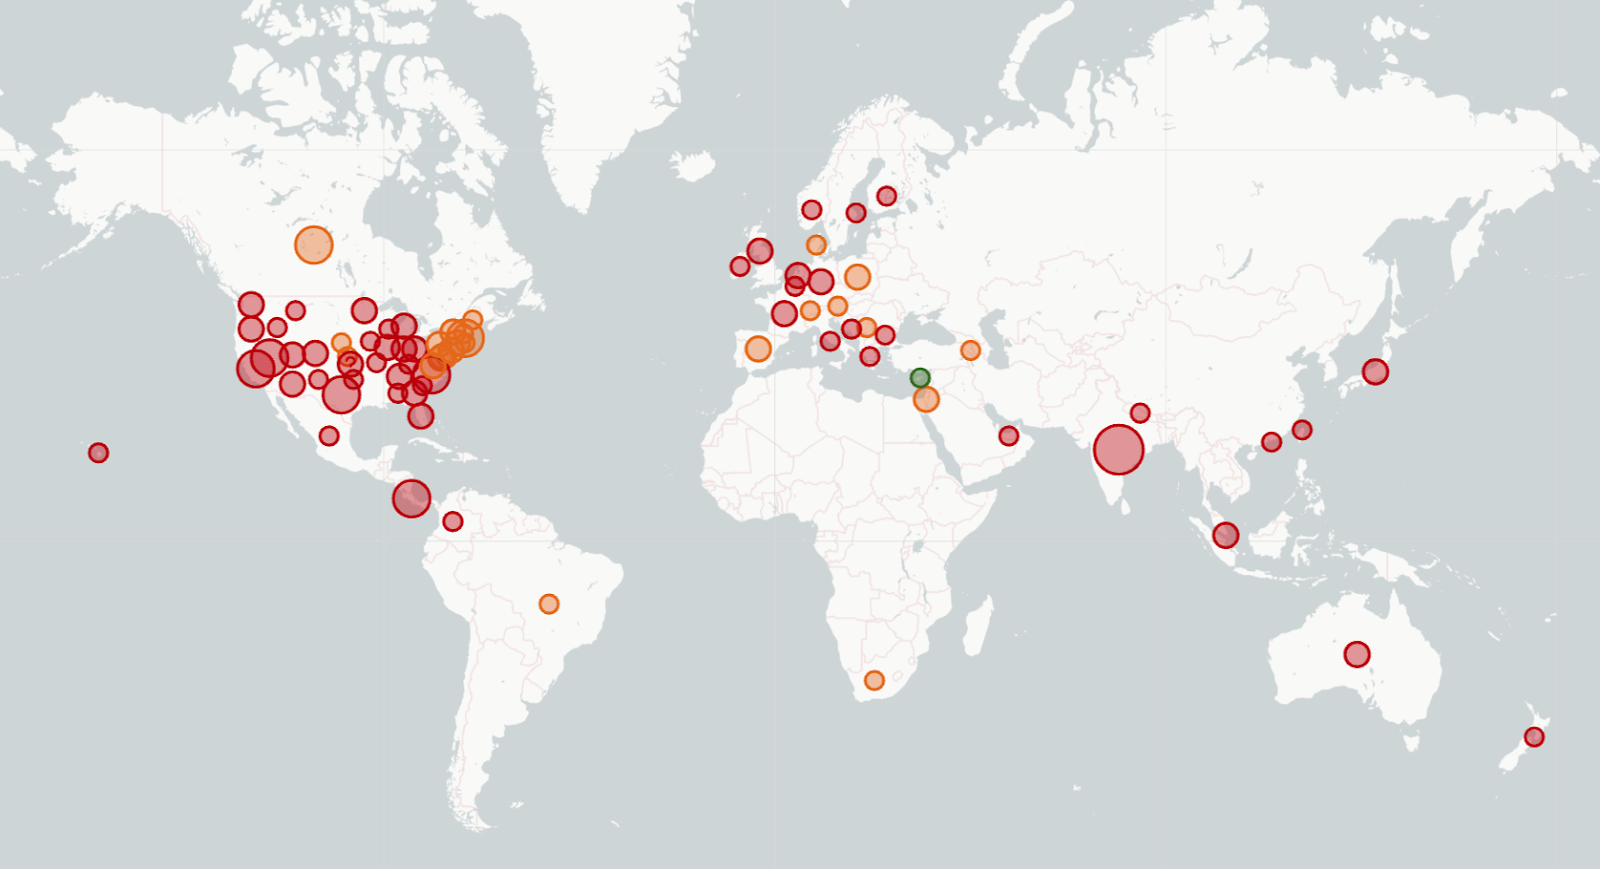
ZDX dashboard indicating a widespread ServiceNow outage
ZDX enables customers to proactively identify and quickly isolate service issues, giving IT teams confidence in the root cause, reducing mean time to resolve (MTTR) and first response time (MTTD).
The ZDX Incident Dashboard includes ML models to detect problems in applications, Wi-Fi, Zscaler data centers, last mile and intermediate ISP, and the endpoint, with automated AI-powered correlation. The dashboard includes incidents that have occurred in the last two weeks, with details on who was impacted, when, and where.
The Incident Dashboard below captured the issue across the entire data path and identified the outage as an “application” issue. In the Incident Details page, you can drill down to further understand the area of impact, epicenter, who is affected, and where.

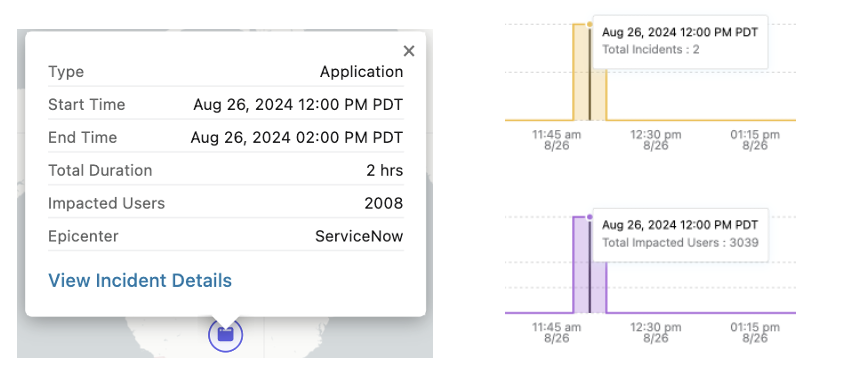
ZDX Score highlights ServiceNow outage
Visible on the ZDX admin portal dashboard, the ZDX Score represents all users in an organization across all applications, locations, and cities on a scale of 0 to 100, with the low end indicating a poor user experience. Depending on the time period and filters selected in the dashboard, the score will adjust accordingly.
The dashboard shows that the ZDX Score for the ServiceNow probes dropped to Poor during the outage window of approximately 2 hours. From within ZDX, service desk teams can easily see that the service degradation isn’t limited to a single location or user and quickly begin analyzing the root cause.
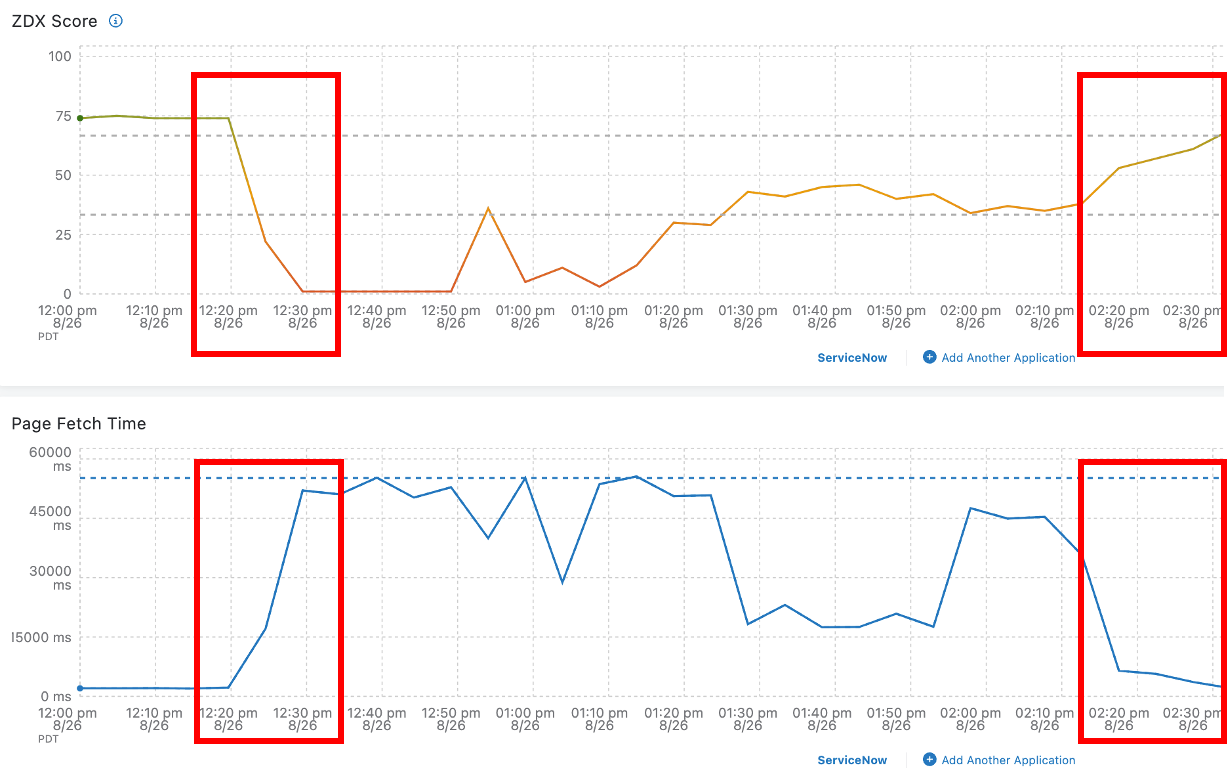
ZDX dashboard showing ServiceNow global issues
Also in the ZDX dashboard, “Web Probe Metrics” highlight the user impact of reaching ServiceNow across a timeline with response times. In this case, the server responded with high page fetch times, indicating the server was not ready to handle requests.
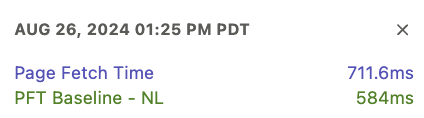
ZDX Web Probe Metrics indicating high response times
ZDX can quickly identify the root cause of user experience issues with AI-powered root cause analysis. This spares IT teams the labor of sifting through fragmented data and troubleshooting, helping accelerate resolution and keep employees productive.
With a simple click in the ZDX dashboard, you can analyze a score, and ZDX will provide insight into potential issues. As you can see, in the case of this ServiceNow outage, ZDX highlights that the network is impacted.

ZDX AI-powered root cause analysis indicates the reason for the outage
It's evident that the network was the fundamental problem. This is supported by AI-powered root cause analysis, which confirmed that the issue originated at the network level. IT teams can further confirm this by reviewing the Cloud Path metrics from the user to the destination.
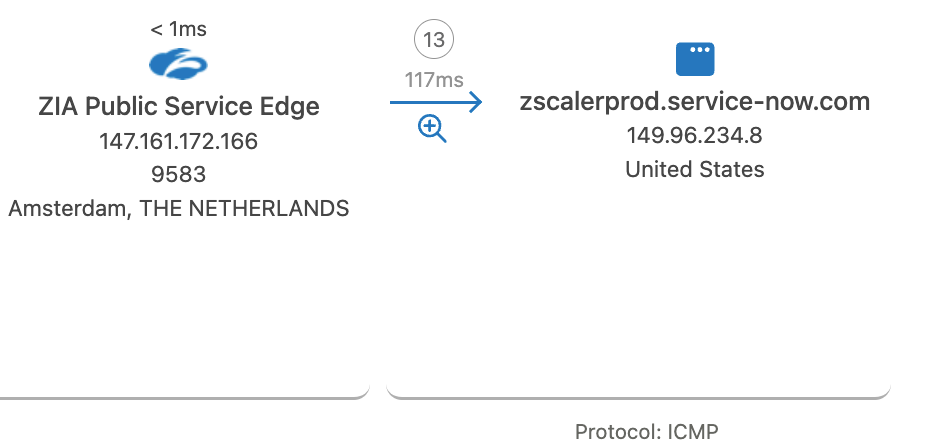
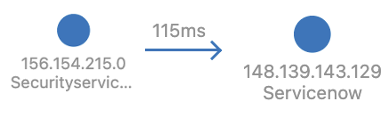
ZDX Cloud Path showing full end-to-end data path
Furthermore, ZDX's AI-powered analysis and dynamic alerts equip IT teams to quickly distinguish between optimal and suboptimal user experiences by setting intelligent alerts for deviations in performance metrics. ZDX enables the comparison of different time points to highlight variations, helping teams recognize the differences between satisfactory and unsatisfactory user experiences through visual contrasts in application, network, and device metrics.
The support page on ServiceNow noted an ISP issue that led to packet loss, performance drops, and sporadic availability issues when accessing ServiceNow. This problem was resolved by 2:35 p.m. PDT, aligning with the ZDX data mentioned. ServiceNow services began to show signs of recovery shortly thereafter.
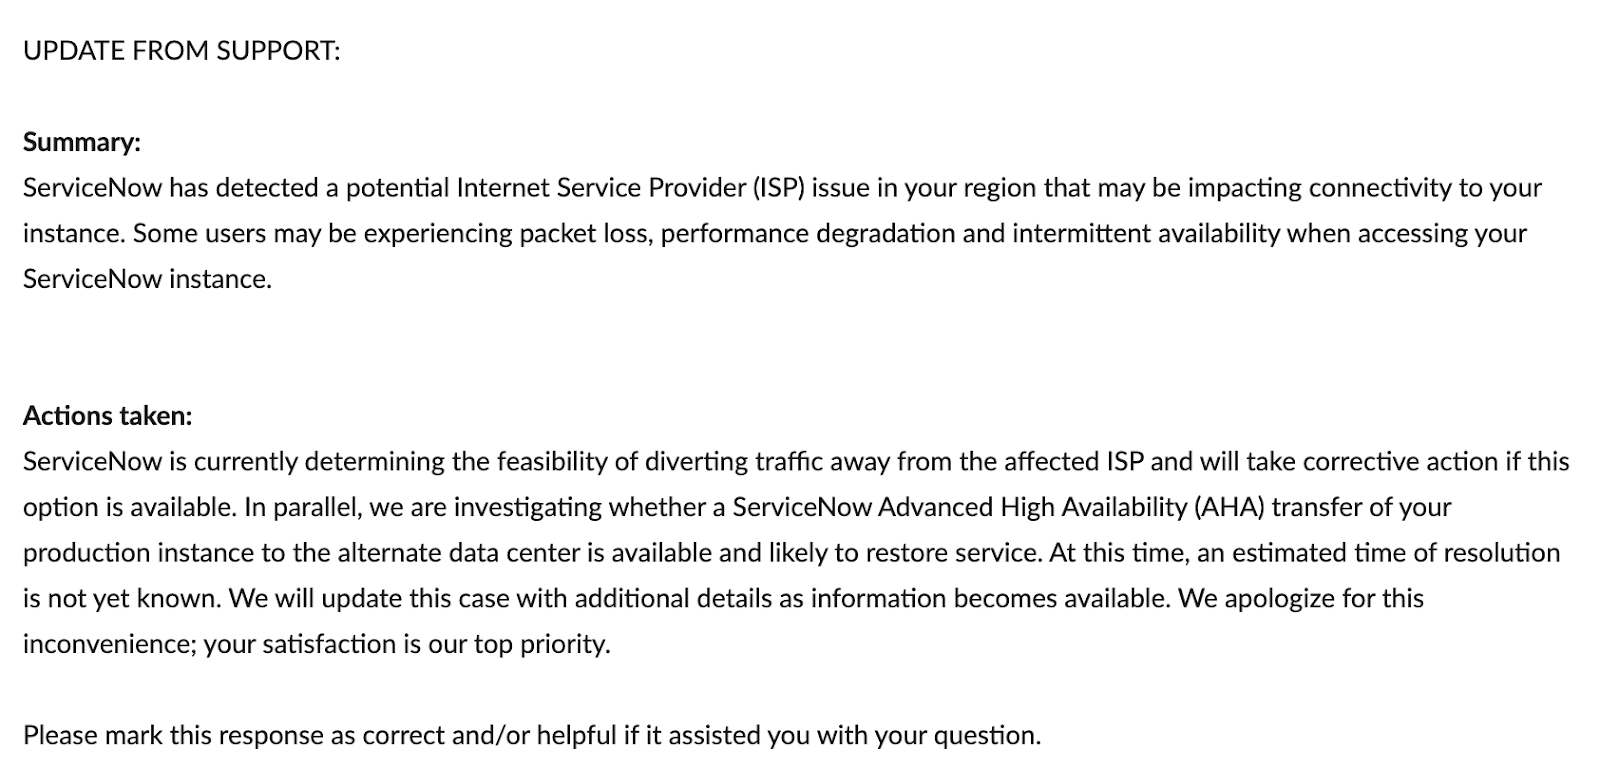
Source: ServiceNow
ZDX alerting enabled proactive notifications to our customers about end user issues, automatically initiating incidents with our service desk well before users reported issues. From a single dashboard, customers could swiftly pinpoint the problem as a ServiceNow issue rather than an internal network outage, thus conserving valuable IT resources.
Try Zscaler Digital Experience today
ZDX enables IT teams to oversee digital experiences from the user's point of view, enhancing performance and quickly resolving issues related to applications, networks, and devices.
Get in touch with us to discover how ZDX can benefit your organization.


