Blog Zscaler
Ricevi gli ultimi aggiornamenti dal blog di Zscaler nella tua casella di posta
My Cloud Connector Monitoring Stack – Part 2: Build It Yourself with AWS CloudFormation
In Part 1, I showed what a cloud-native monitoring stack for Zscaler Cloud Connectors can look like using AWS CloudWatch — complete with dashboards, metrics, and alerting. In this post, we’ll take the next step: automating the setup. I’ll walk you through a reusable CloudFormation template that builds the dashboard, sets up alarms, and ties in your CloudWatch Network Monitor probes (with a few caveats). Whether you’re experimenting in a lab or looking to accelerate production readiness, this template gives you a head start.
Why CloudFormation
I get it — many organizations standardize on Terraform, and everything here can absolutely be done with it as well. But for the sake of time (I do have a day job at Zscaler!), it was simply faster — and selfishly, easier — for me to use CloudFormation. It’s not perfect, but what I’ve put together is:
- Easy to deploy consistently without changes
- Easy to extend and customize for your needs
- Parameterized to support required inputs
- Able to optionally create alarms for email alerts
That said, you can always take this base and “translate” it into Terraform — the metrics, math expressions, and logic are identical regardless of how you choose to deploy.
Deployment
Create CloudWatch Synthetic Monitor
In order to utilize the Network RTT in the Dashboard (and alerts) you will need to manually create a CloudWatch Synthetic Monitor with two probes in order to reference. Please note this is currently a limitation with CloudFormation — it does not currently support the creation of these resource types.
note: I currently have this configured for a single AZ so you would need to alter the dashboard and alerts to account for multi-AZ configs
Navigate to AWS > CloudWatch > Networking Monitoring > Synthetic monitors
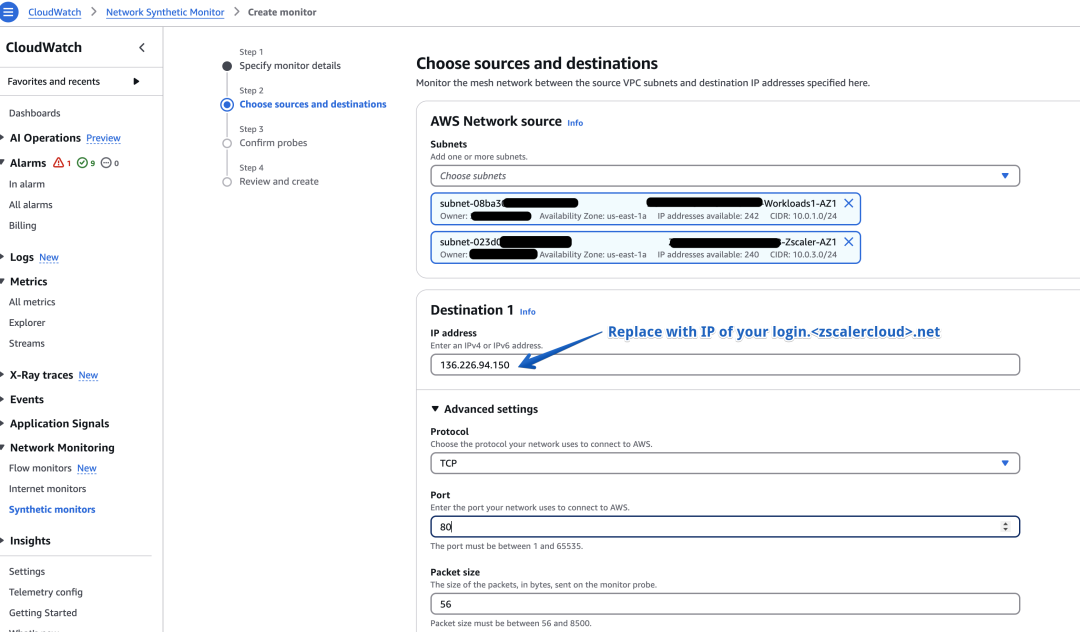
Create a new Network monitor with settings:
- Monitor name: something like "zscc-vpc1234-monitor"
- Subnets: Select the Zscaler Subnet where the Cloud Connectors are deployed AND one subnet that is configured to route to Zscaler
- Destination 1: Insert the public IP of a trusted destination. This is a bit subjective as the destination servers could be the problem and not related to AWS or Zscaler, but in my lab I took the resolved IP address for the login page of the Zscaler cloud my lab is in, such as login.zscalerthree.net
- Advanced Settings:
- Protocol: TCP
- Port: 80
- Packet size: 56

Once the monitor is created, navigate to the Monitor details page and take note of the two probe ids that were created along with which one is the Zscaler subnet vs the Workload subnet. You'll need these items for the CloudFormation template
Obtain Parameters
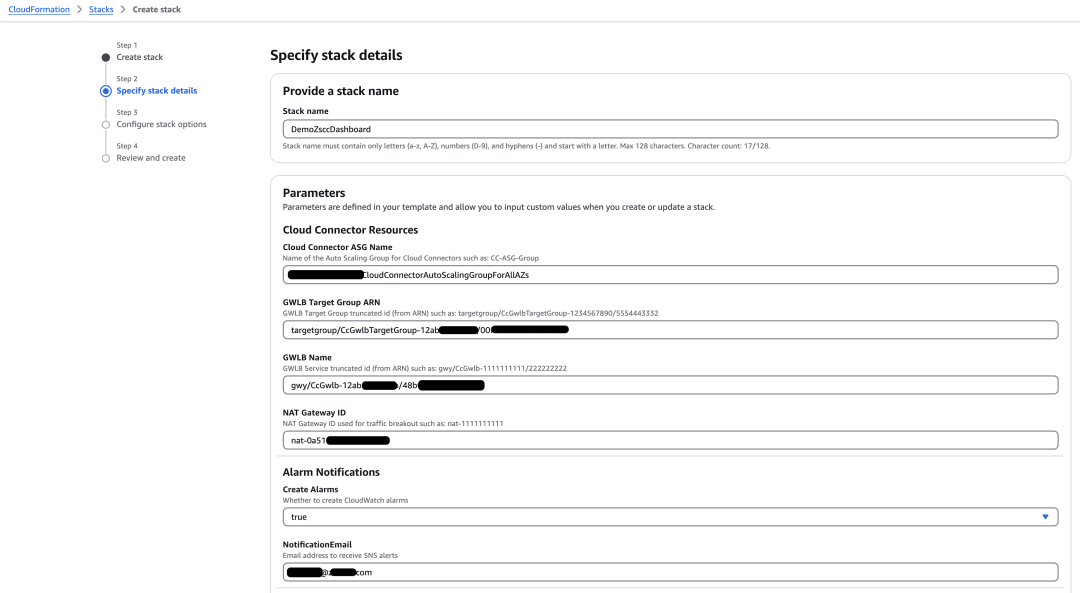
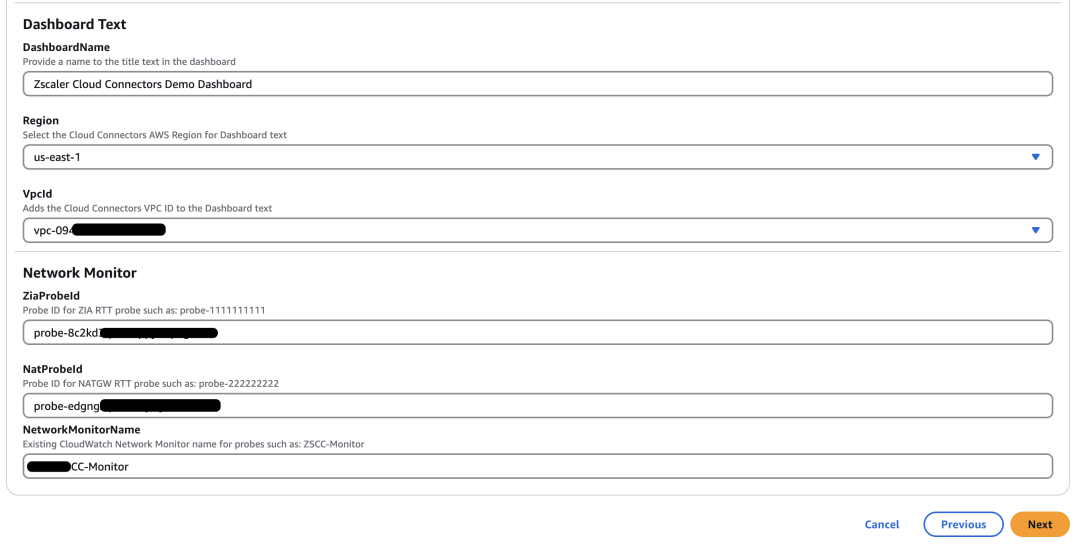
The CloudFormation template will ask for a variety of inputs. I won't explain each of them but the ones that might be a little bit tricky because CFT doesn't support Lists to make selections for all the inputs. I also wanted to simplify without asking for full ARNs which would require my CFT to then trim the inputs to the expected objects.
Keep in mind this CFT deploys the metrics, widgets, alarms all based on a single set of Cloud Connectors. If you need to support other configurations you can adjust the CFT and update the math expressions accordingly
| Parameter | Example | Where and how to get this |
| AutoScalingGroupName | MY-ZSCC-ASG | AWS > EC2 > Auto Scaling Groups Copy the Name of the ASG |
| TargetGroup | targetgroup/CcGwlbTargetGroup-12345-67890 | AWS > EC2 > Load Balancers Select the LB Copy/Paste the ARN Trim (remove) everything before "gwy" |
| LoadBalancerName | gwy/CcGwlb-12345/67890 | AWS > EC2 > Target Groups Select the Target Group Copy/Paste the ARN Trim (remove) everything before "targetgroup" |
| NatGatewayId | nat-01234567890 | AWS > VPC > NAT Gateways Copy/Paste the NAT Gateway ID |
| NetworkMonitorName | MY-ZSCC-MONITOR | AWS > CloudWatch > Network Monitoring > Synthetic Monitors Copy/Paste the Monitor Name |
| ZiaProbeId | probe-01234567890 | AWS > CloudWatch > Network Monitoring > Synthetic Monitors Click on your ZSCC Monitor > Monitor details Copy/Paste the Probe ID for Zscaler subnet |
| NatProbeId | probe-09876543210 | AWS > CloudWatch > Network Monitoring > Synthetic Monitors Click on your ZSCC Monitor > Monitor details Copy/Paste the Probe ID for Workload subnet |


Download and Deploy CloudFormation Stack
- Download the CloudFormation template (YAML format) from my personal GitHub aws-cloudwatch-zs-cloudconnectors repository
- Deploy via AWS CLI or via AWS Console > CloudFormation
- Enjoy the Dashboard :)
Easy peasy! Now you'll have the CloudWatch Dashboard, the alarms, and the data should start populating shortly thereafter! If you forgot what this deploys then please refer back to Part 1 Blog in which I detail the dashboard, alarms, etc (including screenshots)
Caveats and Nuances
Before you run with this setup, a few important notes to keep in mind (some of them I'm restating to be clear). This will help you with knowing what is perfect information vs a starting point you can expand on:
- Single ASG across AZs Assumption. Cloud Connectors can be deployed with CFT or Terraform to be 1 ASG across the AZs or 1 ASG per AZ. For simplicity my lab is 1 ASG across AZs to make it simpler to obtain all the metrics
- One NAT Gateway for the VPC. For simplicity even with multiple AZs my lab has 1 NAT Gateway. Realistically most customers will have 1 per AZ
- Data Transfer ≠ Exact Science: Metrics like GWLB Processed Bytes, Cloud Connector (custom metric) Data Plane Bytes In/Out, and NAT Gateway Bytes are all helpful - but they don't always align perfectly. That's because:
- They measure different points in the flow
- They may report data at different intervals
- They can miss spikes or larger transfers depending on timing
For example, a 10GB file transfer within a short 5-minute window might not show up in the same way across all of these metrics. There are directional differences to keep in mind so it's best to use these data points as a baseline to further guide tuning and investigation when there are issues or anomalies
Closing: What's Next
Short and sweet. This wraps up Part 2. You now have a template to stand up your own monitoring baseline with CloudWatch—alerts, dashboards, and probes included.
In Part 3, we’ll do something similar by exploring what's possible in Azure. GCP fans, you’re next!
Questo post è stato utile?
Esclusione di responsabilità: questo articolo del blog è stato creato da Zscaler esclusivamente a scopo informativo ed è fornito "così com'è", senza alcuna garanzia circa l'accuratezza, la completezza o l'affidabilità dei contenuti. Zscaler declina ogni responsabilità per eventuali errori o omissioni, così come per le eventuali azioni intraprese sulla base delle informazioni fornite. Eventuali link a siti web o risorse di terze parti sono offerti unicamente per praticità, e Zscaler non è responsabile del relativo contenuto, né delle pratiche adottate. Tutti i contenuti sono soggetti a modifiche senza preavviso. Accedendo a questo blog, l'utente accetta le presenti condizioni e riconosce di essere l'unico responsabile della verifica e dell'uso delle informazioni secondo quanto appropriato per rispondere alle proprie esigenze.
Ricevi gli ultimi aggiornamenti dal blog di Zscaler nella tua casella di posta
Inviando il modulo, si accetta la nostra Informativa sulla privacy.


