Zscaler 部落格
訂閱 Zscaler 部落格,第一時間獲取最新資訊!
Agentless Runtime Signals for the AI Factory: Streaming NVIDIA DOCA Argus Telemetry into Zscaler Data Fabric and Exposure Management

Agentless Runtime Signals for the AI Factory: Streaming NVIDIA DOCA Argus Telemetry into Zscaler Data Fabric and Exposure Management
AI factories and industrial edge deployments are built for throughput, latency, and uptime—and have complex architecture including: containerized workloads, multi-tenant clusters, and fast-changing software stacks. Security teams aren’t short on telemetry. They’re short on answers and time.
When vulnerability scanners, cloud posture tools, EDR, identity platforms, CMDBs, and runtime detections all live in separate siloes, you get noisy queues, duplicate tickets, and risk decisions that are hard to defend. If you can unify high-fidelity runtime signals with exposure context and business logic, you can prioritize the work that measurably reduces risk—without slowing down AI performance.
That’s where teaming NVIDIA DOCA Argus with the Zscaler Data Fabric for Security and Zscaler Exposure Management becomes powerful: it turns out-of-band runtime telemetry into contextual risk decisions and action-oriented workflows.
Why AI and edge environments need out-of-band visibility
AI clusters and edge platforms need runtime visibility that doesn’t depend on the host. Host agents can be difficult to standardize on performance-sensitive nodes and are vulnerable to tampering if a host is compromised. Perimeter-only views often miss what matters most: process activity, memory-level behavior, and lateral movement.
NVIDIA DOCA Argus framework was designed to fill this gap. It runs independently of the host in its own trust domain on NVIDIA BlueField DPUs, uses DMA access to inspect host memory, and decodes it into logical signals such as process and thread data. DOCA Argus produces structured output—events, alerts, and system activity messages in JSON or syslog—and that data can be exported via Fluent Bit to downstream security platforms and data lakes.
The differentiator: turning telemetry into risk decisions
Telemetry alone doesn’t reduce risk. In many environments, runtime detections live in siloed source tools without context, requiring security teams to export and attempt to stitch together a holistic view. This manual approach is time consuming and incredibly difficult to assess risk in a way that accounts for asset criticality, ownership, patch status, compensating controls, and business impact. The result is predictable: duplicated findings and remediation driven by severity labels rather than business-relevant risk.
The Zscaler Data Fabric for Security is built to solve this. It aggregates and unifies data across security tools and business systems, then harmonizes, deduplicates, correlates, and enriches that data into a single source of truth that powers exposure management. Because the fabric’s data model is flexible, it can incorporate new data sources, like DOCA Argus runtime events, without forcing you to redesign your program around a single tool’s schema.
This combined solution addresses key exposure management challenges:
- Solving the "So What?" Problem: Aggregating Argus runtime telemetry with business and asset context from the Data Fabric and Exposure Management provides immediate answers on asset criticality and business impact, moving beyond simple severity labels.
- Eliminating Alert Fatigue and Data Silos: The Data Fabric unifies high-volume detections from Argus and other sources, correlating and deduplicating them to present a clear, risk-prioritized view instead of overwhelming security teams with disparate alerts.
- Driving Business-Relevant Remediation: By unifying detection (Argus) with business context from other relevant sources (Data Fabric) and asset visibility (Exposure Management), the solution focuses remediation efforts on the findings that pose the greatest risk to the organization's critical assets and business processes.
A practical architecture: DOCA Argus → FluentBit → Data Fabric → Exposure Management
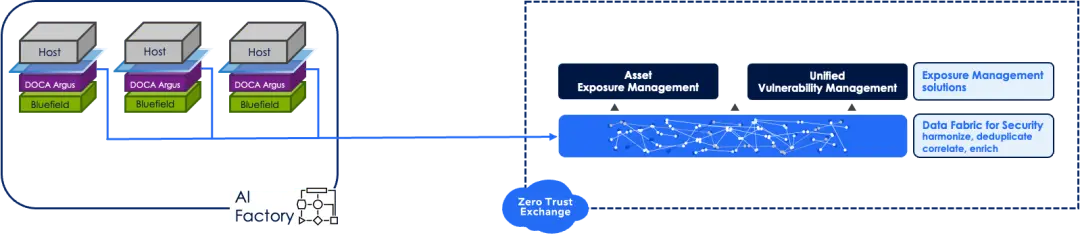
This deployment pattern aligns directly to the use case of streaming DOCA Argus events into Zscaler Data Fabric and then ingesting them into our Exposure Management solution.
1) Generate trusted runtime signals at the infrastructure layer
DOCA Argus collects raw activities from host memory and uses a policy engine to filter noise, surfacing meaningful events and alerts. In AI and edge contexts, you gain runtime threat events without adding host CPU agents.
2) Stream events with FluentBit
FluentBit collects DOCA Argus output and forwards it onward using standard pipelines. Because it can emit JSON or syslog, you can export data in formats downstream systems can parse consistently.
3) Ingest into the Zscaler Data Fabric for Security
The Data Fabric supports 200+ out-of-the-box connectors, and the AnySource™ connector can ingest data from virtually any system and in a variety of formats. Once ingested, entity resolution ties DOCA Argus records to the correct real-world entities: the specific GPU node, workload, cluster, environment, and owner.
4) Correlate and enrich with exposure context
This is where “events” become “risk.” The Data Fabric can connect DOCA Argus telemetry to vulnerability findings and exploitability signals, identity and user behavior, asset inventory and ownership, and mitigating controls. For example, DOCA Argus events can automatically elevate the priority of exposure findings, allowing security teams to quickly identify critical exposures before they become active threats. By normalizing and deduplicating data in real time, then correlating it across sources, you can see relationships that are hard to detect when each tool stays in its own silo.
5) Operationalize in Zscaler Exposure Management
Zscaler Exposure Management is built on the Data Fabric and is designed to help teams prioritize their biggest risks, automate remediation workflows, and report progress with always-up-to-date dashboards. It correlates findings and context spanning identity, assets, user behavior, mitigating controls, business processes, and organizational hierarchy.
For AI and edge environments, the key point is that Exposure Management isn’t limited to CVEs. It can ingest any risk factor or mitigating control, and you can customize the factors and weighting that constitute your risk score to match how the business defines risk.
That is how DOCA Argus Framework runtime events become decision leverage:
- A high-severity DOCA Argus alert on a node that also has known exploited exposure can be escalated automatically.
- The same alert on a lab node with strong mitigating controls can be scored differently to reduce noise.
- Repeated DOCA Argus activity tied to a workload can drive a workflow that routes the issue to the right owner with supporting evidence already correlated.
From insights to action
In AI factories and industrial edge deployments, “response” is often a blend of security and platform engineering. The goal is to reduce risk quickly with minimal operational friction. With the Data Fabric + Exposure Management approach, actions can include:
- Consolidated remediation: deduplicate findings so multiple tools and signals roll up into a single remediation task instead of dozens of duplicates.
- Risk-based prioritization: focus patching, hardening, and configuration work on what is most likely to cause business impact.
- Workflow automation: drive remediation via ticketing systems, track KPIs/SLAs, and close the loop when work is complete.
Why this matters now
AI factories and edge platforms concentrate expensive compute, proprietary models, sensitive data, and business-critical workflows. Approaches that rely on “patch everything” or “alert on everything” don’t scale.
By streaming DOCA Argus events via FluentBit into the Zscaler Data Fabric for Security—and operationalizing them in Zscaler Exposure Management—teams can shift from raw telemetry to a unified, contextual view of risk that reduces duplication and focuses engineering effort where it actually lowers exposure.
Making DOCA Argus telemetry usable for exposure management
DOCA Argus telemetry records are structured and carry consistent metadata—message type, severity, timestamps, and system context. You can also attach custom metadata as events are exported (for example, to tag a cluster name, environment, or owner). That makes it straightforward to treat Argus output as a first-class risk signal instead of an unstructured log stream.
In the Data Fabric, the key is mapping each Argus record into the same entity model you use for exposure management. At minimum, every event should resolve to an asset identity (GPU node or edge appliance) and, where possible, a workload identity (VM/container/service). From there, you can enrich it with environment (prod vs. dev/test), ownership, and organizational hierarchy—so the same event can be prioritized differently depending on business impact.
Once those relationships exist, Argus alerts can be incorporated into Exposure Management as an additional risk factor that influences contextual risk scores and workflows. That’s especially valuable for “gray area” decisions where severity alone would drive a patch-everything response, but runtime signals and business context help you decide what must be addressed first.
Operational outcomes you can measure
Because Zscaler Exposure Management is designed to deduplicate and correlate findings into consolidated remediation tasks, teams can reduce the “ticket storm” problem and spend more time fixing the exposures that matter. Zscaler has published customer-reported outcomes such as dramatic ticket consolidation and increased triage capacity; outcomes will vary by environment.
A simple way to start
- Deploy DOCA Argus and enable telemetry export (JSON or syslog), forwarded by Fluent Bit.
- Ingest Argus output into the Data Fabric (often via AnySource) and define entity resolution keys.
- Configure Exposure Management contextual scoring inputs and remediation workflows (including ticketing).
- Iterate: refine scoring and grouping rules, and add more signals as your AI/edge footprint grows.
For information on Nvidia Bluefield and DOCA Argus see https://www.nvidia.com/en-us/networking/products/data-processing-unit/
For information on Zscaler Data Fabric and Exposure Management please find the product information here.


免責聲明:本部落格文章由 Zscaler 製作,僅供資訊參考,並以「現狀」提供,不保證其準確性、完整性或可靠性。Zscaler 對任何錯誤或遺漏,或基於所提供的資訊而採取的任何行動不承擔任何責任。本部落格文章中連結的任何第三方網站或資源僅為方便起見而提供,Zscaler 對其內容或做法概不負責。所有內容如有變更,恕不另行通知。存取此部落格,即表示您同意這些條款,並承認您有責任自行驗證並根據您的需求適當使用資訊。