Zscaler 部落格
訂閱 Zscaler 部落格,第一時間獲取最新資訊!
Introducing Red Canary CWP Shell Activities

Understand what commands have run inside your cloud workloads, follow activity and user behavior more easily, and conveniently play back history in your environment.
This article was originally published by Red Canary, which is now part of Zscaler.
Red Canary is proud to announce Shell Activities capability for its MDR for Infrastructure solution. Shell Activities is a new way to filter, sort, and search through all commands run in shells across your cloud workloads.
What are shells and commands?
Shells allow you to run commands on Linux systems so that you can take actions such as opening and editing files, running scripts, or managing applications. Commands are human readable stand-ins for code or operations on Linux, turning a task like executing a script into a simple, single command (./). Commands and shells are powerful tools, not inherently malicious, and used by admins and others for legitimate reasons.
However, malicious actors can also use commands and shells to put your systems at risk. The same powerful tools used by your developers and administrators can allow malicious actors to exploit vulnerabilities, manipulate files and applications, and steal data.
Detecting threats with commands run in shells is a standard requirement for cloud workload protection products. However, displaying all commands run alongside the right context to investigate your data is unique to MDR for Infrastructure. We designed our new Shell Activities functionality to give you confidence and visibility into this part of development and security operations, offering admins a single view of all shell commands run across all workloads that are managed by MDR for Infrastructure.
Shell Activities at a glance
The Shell Activities feature builds on existing detection capabilities in MDR for Infrastructure that look at threats taking place in shells and associated with specific commands. MDR for Infrastructure already collects and alerts on malicious activity happening in shells. The new Shell Activities function takes this same command information and reports one month of all commands run in your workloads into a new Activities page of the Red Canary Portal.
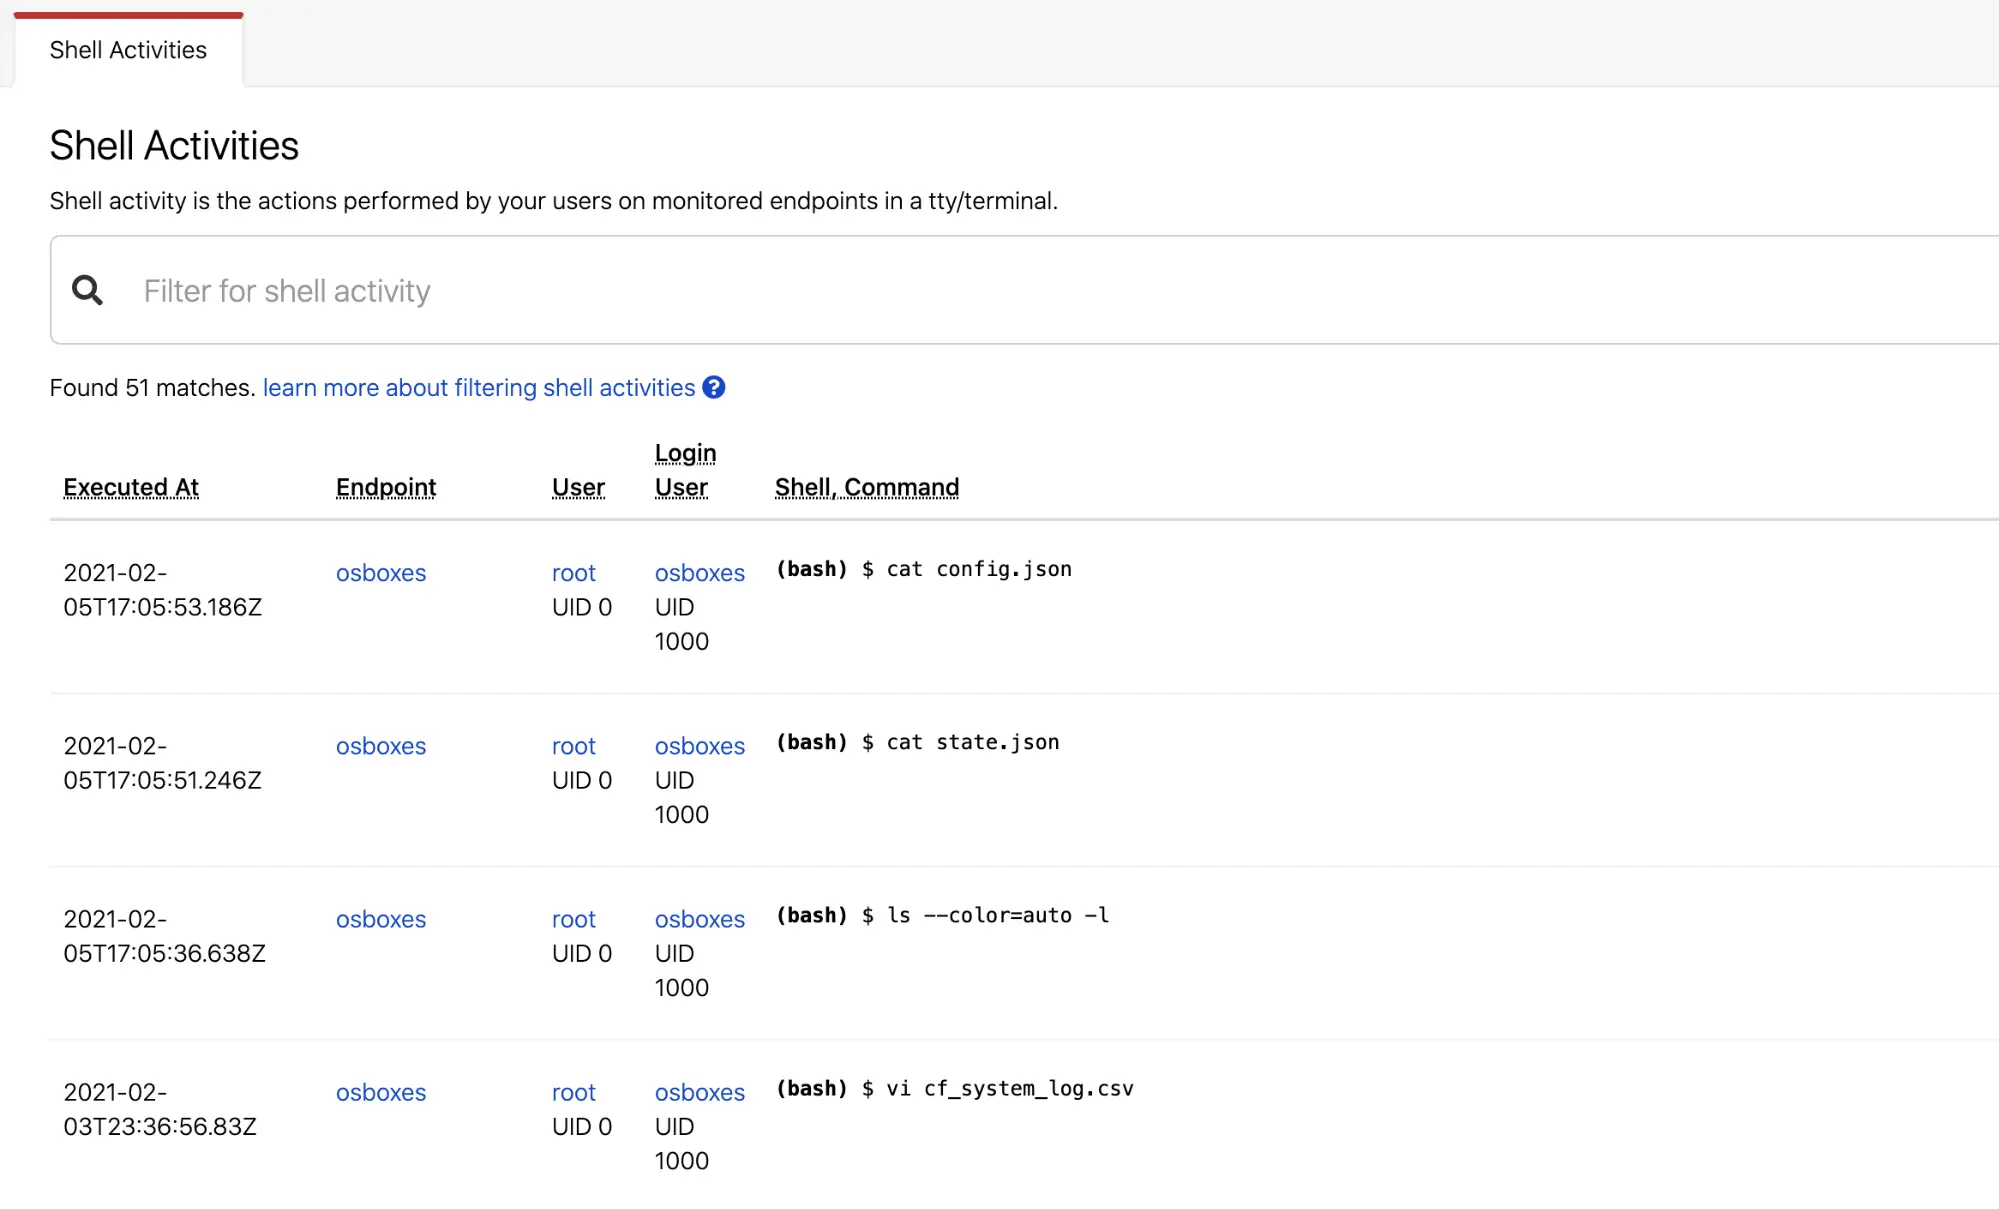
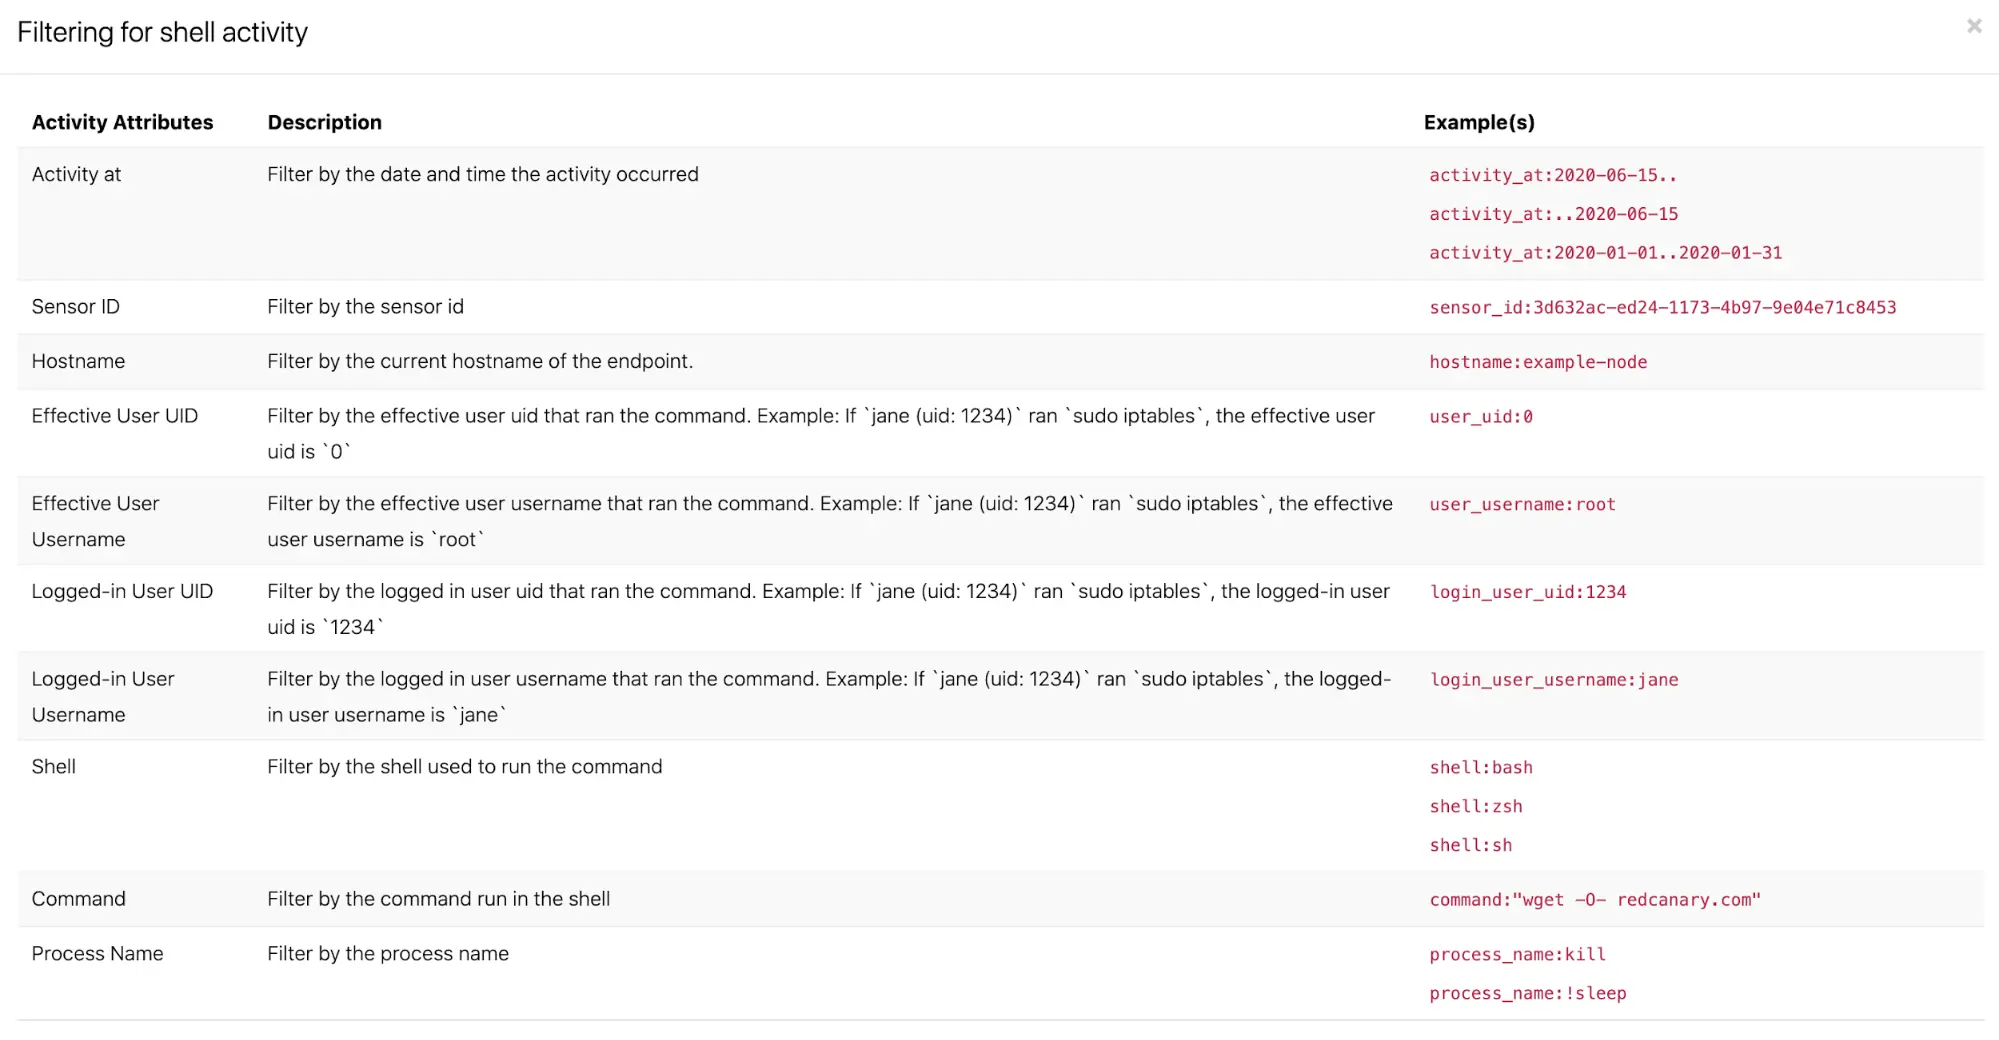
Shell Activities offers a timeline view of each command alongside information about the user and workload, as well as the specific command run. You can search and filter by a wide range of metadata, including narrowing results to a specific time range, user, workload, or even arbitrary string or command.
Use cases
Shell Activities brings benefits to both development leaders and security admins. On the DevOps side, Shell Activities provides instant visibility into shells and commands, while on the SecOps side, the feature offers a path for understanding and auditing shell behaviors.
DevOps leaders
Search by anything: Want to see every time someone used sudo? Want to see what happened leading up to an outage on Tuesday night at 7:34 PM? Need to see why 25 machines simultaneously restarted? Shell Activities enables you to instantly filter down and search commands so that you no longer have to skim audit logs or log into every machine to keep track of how users are interacting with your cloud workloads.
Put commands in context: Shell commands offer you a wealth of information about what is happening on your workloads and what activity might have led to a particular event. But without aggregation and searching, you are left to review logs by hand or guess at what ran. With Shell Activities, all of your shell commands are put in chronological order across your entire cloud, so that you can drill down by time, users, machines, and even commands to put events in context. Answering questions such as “what commands did this user run?” or “what was changed on this machine?” is now simple.
Look back in time: Look back through a month of shell commands to understand more about your workloads. With Shell Activities, you can look at a whole month of history or drill down to a specific day or time range to focus on exactly what you want. Records aren’t missed just because you didn’t check the machine in time.
SecOps leaders
Audit and understand user behavior: Why did 15 machines just restart all at once? Who pushed a patch to a server that led to downtime? Traditionally, these questions require your team to put in hours of effort searching for an answer. With Shell Activities, you can filter down to a particular machine or user and see exactly what was run and when.
Trust your tool: Shell Activities reports the same data MDR for Infrastructure sees to detect malicious activity in shells and shell commands. When you see data in Shell Activities, you can trust that your sensors are healthy and reporting back valuable data to generate the right detection outcomes.
Investigate incidents: Want to learn more about a detection or security event? Drill down to a particular time range or workload to replay any commands run, so that you can learn more about what led to a security event and provide additional forensic context without the need to pull logs or raw telemetry.
Getting started
Red Canary CWP Shell Activities is now available for any current or future Red Canary customer on an Enterprise or Managed plan. Just head to Activities in your portal to get instant access to all shell commands run in your CWP-supported workloads over the last month.
Want to learn more?


免責聲明:本部落格文章由 Zscaler 製作,僅供資訊參考,並以「現狀」提供,不保證其準確性、完整性或可靠性。Zscaler 對任何錯誤或遺漏,或基於所提供的資訊而採取的任何行動不承擔任何責任。本部落格文章中連結的任何第三方網站或資源僅為方便起見而提供,Zscaler 對其內容或做法概不負責。所有內容如有變更,恕不另行通知。存取此部落格,即表示您同意這些條款,並承認您有責任自行驗證並根據您的需求適當使用資訊。