
Zscaler Digital Experience detects outage
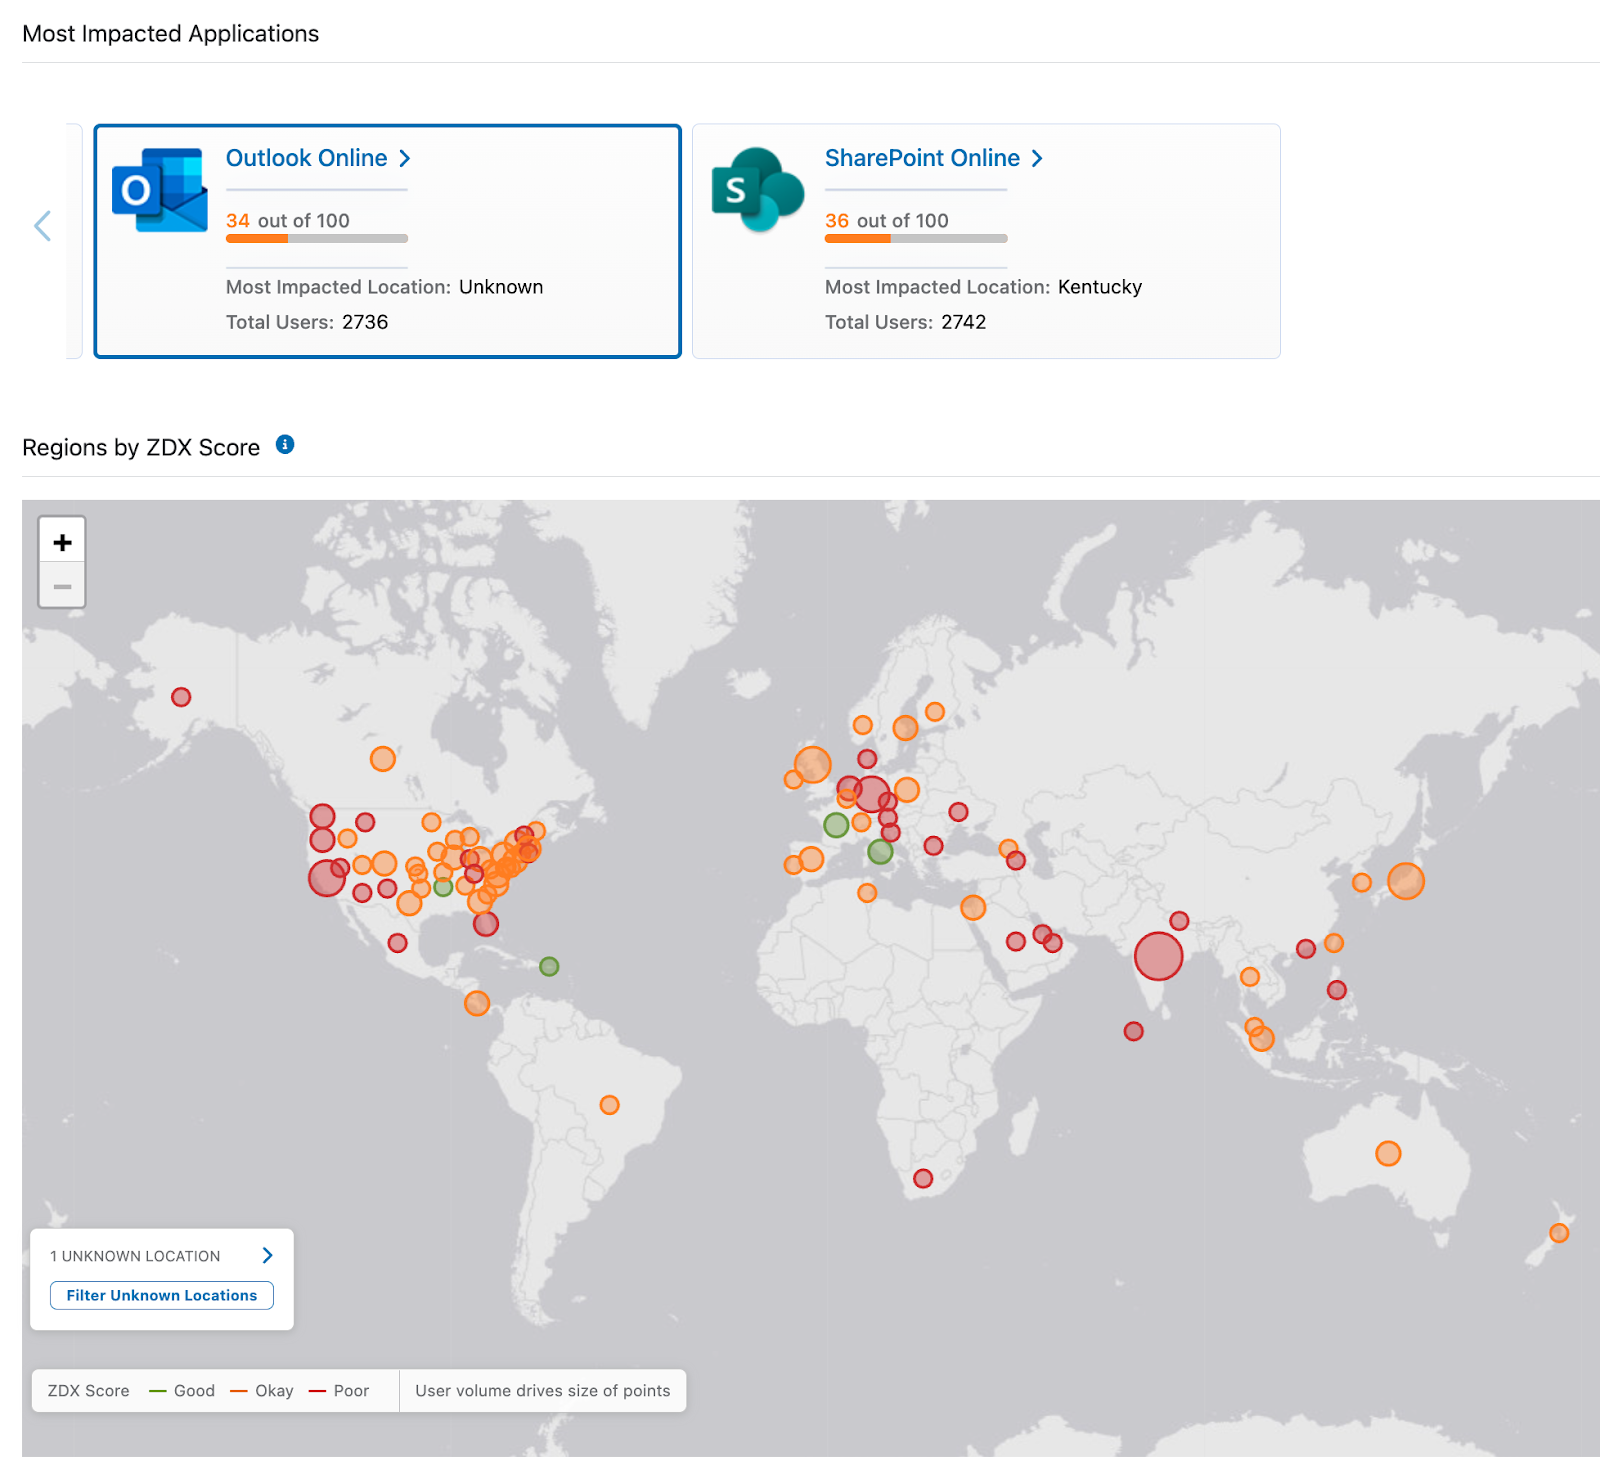
At 11:10 p.m. PST on January 24, 2023, Zscaler Digital Experience (ZDX) saw a substantial, unexpected drop in the ZDX score for Microsoft Azure services across the globe. Upon further analysis, we noticed HTTP 503 Errors highlighting a Microsoft Azure outage, with the ZDX heatmap clearly detailing the impact at a global scale.
With ZDX, customers can proactively identify service issues and quickly isolate them, giving IT teams confidence in the root cause, reducing mean time to resolve (MTTR) and first response time (MTTD).
Zscaler Digital Experience dashboard showing Microsoft global issues
ZDX Score highlights Microsoft outage
A ZDX Score represents all users in an organization, across all applications, locations, and cities. You can see the score on the ZDX Admin Portal dashboard. Depending on the time period and filters selected in the dashboard, the score will adjust accordingly. The ZDX Score is based on a scale of 1 (lowest) to 100 (highest), with the low end indicating a poor user experience.
With further analysis, you can see the ZDX Score for the Microsoft OneDrive, SharePoint, and Outlook probes drop to ZERO during the approximate outage of about 50 minutes according to ZDX. From within ZDX, service desk teams can easily see that the service degradation isn’t limited to a single location or user and quickly begin analyzing the root cause.
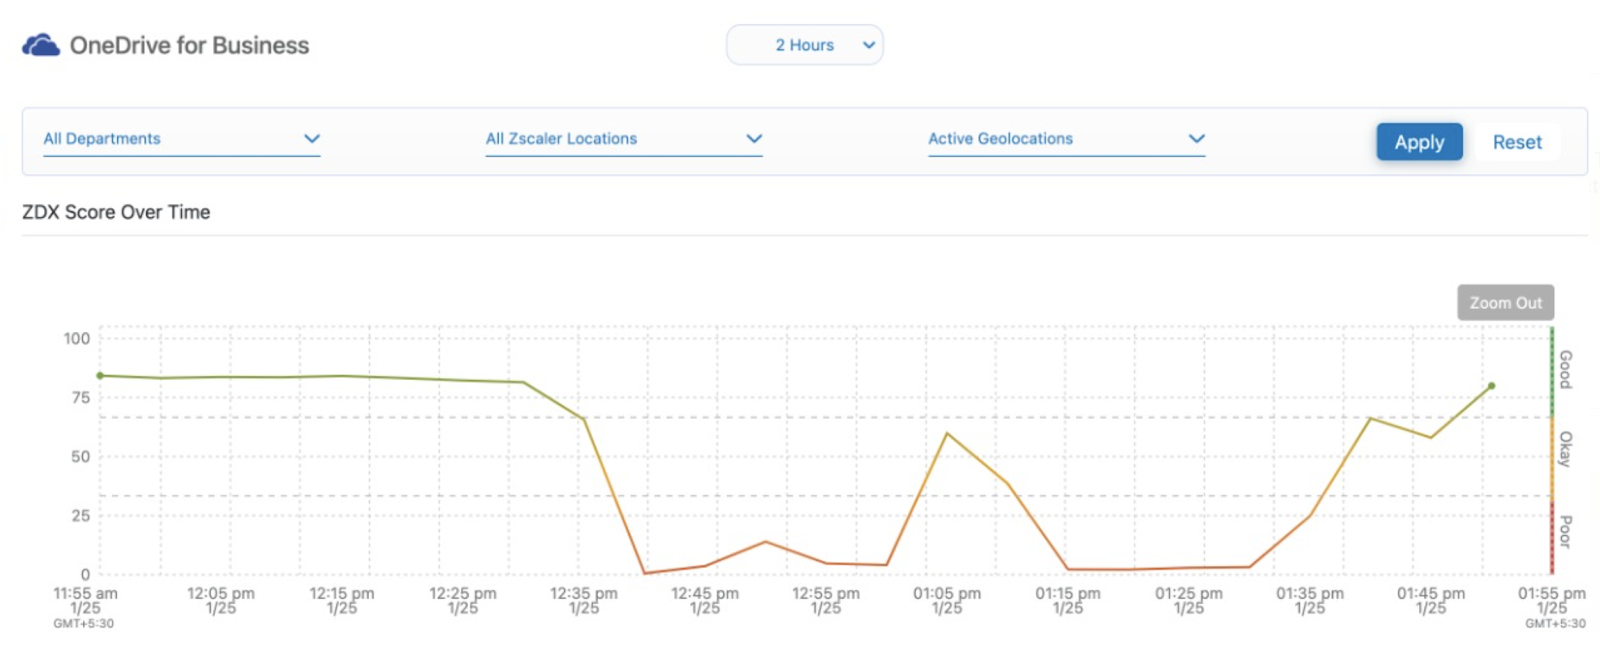
ZDX Score indicating Microsoft OneDrive outage and recovery (times in IST)
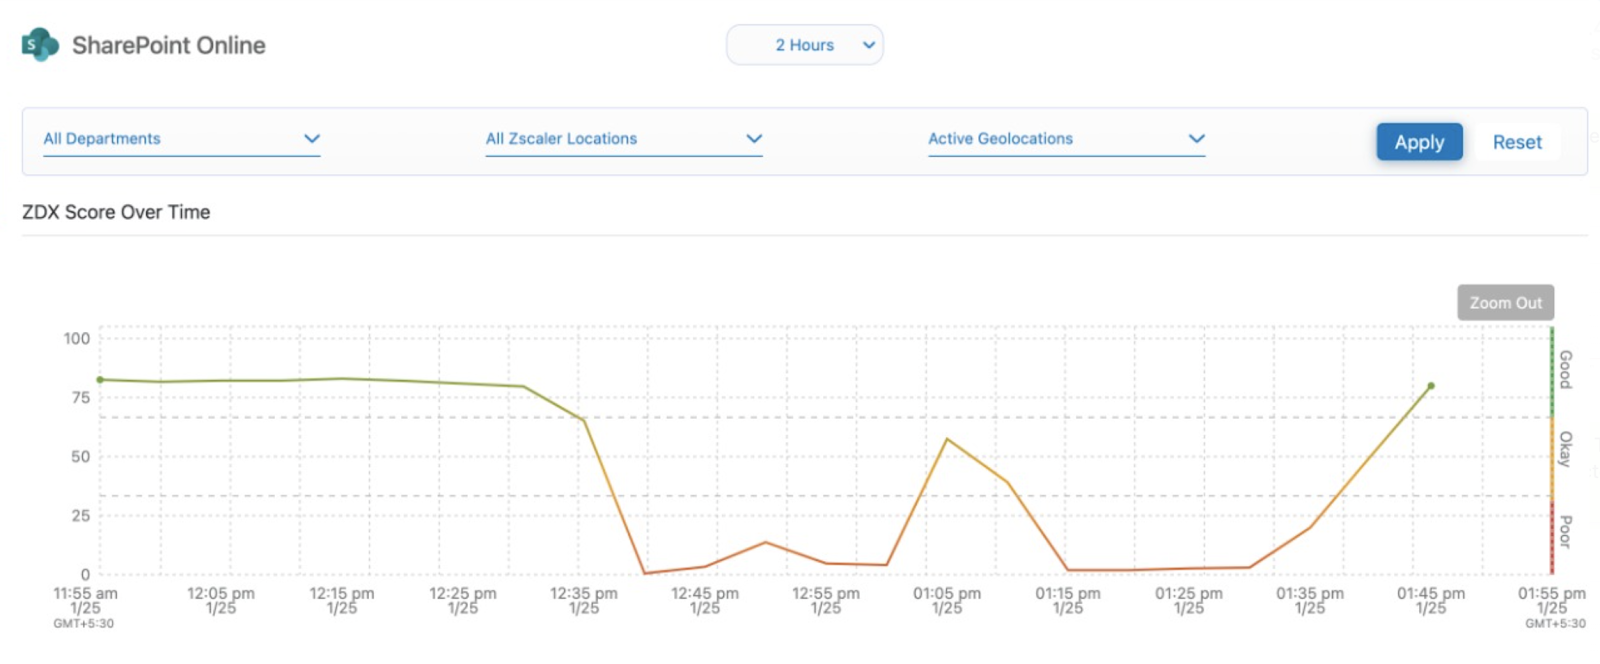
ZDX Score indicating Microsoft SharePoint outage and recovery (times in IST)

ZDX Score indicating Microsoft Outlook outage and recovery (times in IST)
In the ZDX dashboard, you will also see “Web Probe Metrics,”, which highlights the user impact of reaching Microsoft applications across a timeline with response times. In this case, the server responded with 503 errors, indicating the server was not ready to handle requests.

ZDX Web Probe metrics indicating 503 errors (times in PST)
ZDX can quickly identify the root cause of user experience issues with its new AI-powered root cause analysis capability. This spares IT teams the labor of sifting through fragmented data and troubleshooting, thereby accelerating resolution and keeping employees productive.
With a simple click in the ZDX dashboard, you can analyze a low score, and ZDX will provide insight into potential issues. As you can see in the Microsoft outage, ZDX highlights that the application service was not reachable.

ZDX AI-powered root cause analysis indicates the reason for the outage
ZDX AI-powered root cause analysis already identified an issue with overall application responses. You can verify this by looking at the CloudPath metrics from the user to the destination. The ZDX CloudPath details indicate the issue between Microsoft Azure routers.
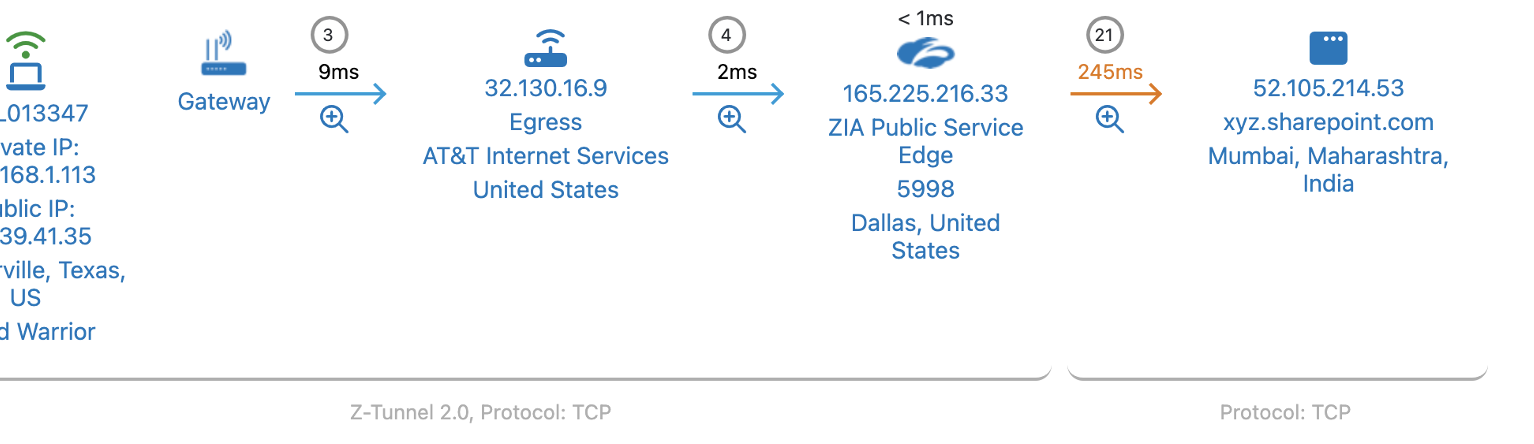
ZDX CloudPath showing end user to destination
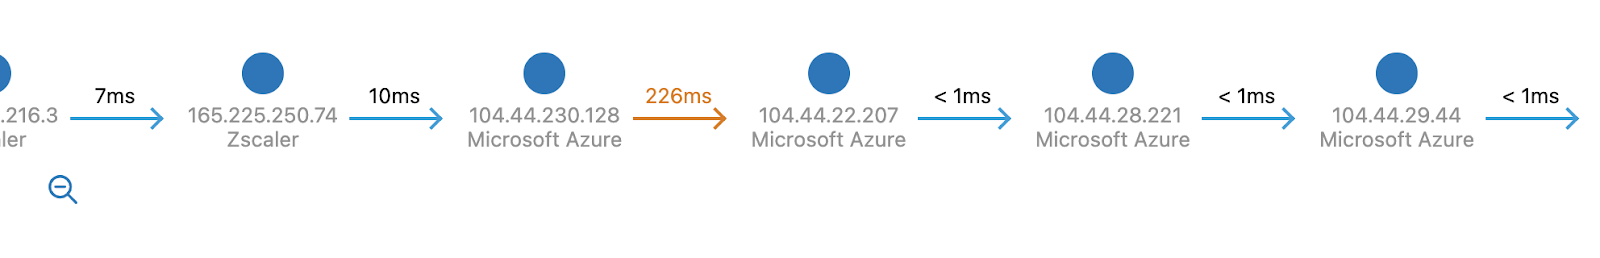
ZDX CloudPath details showing the issue between Microsoft Azure nodes
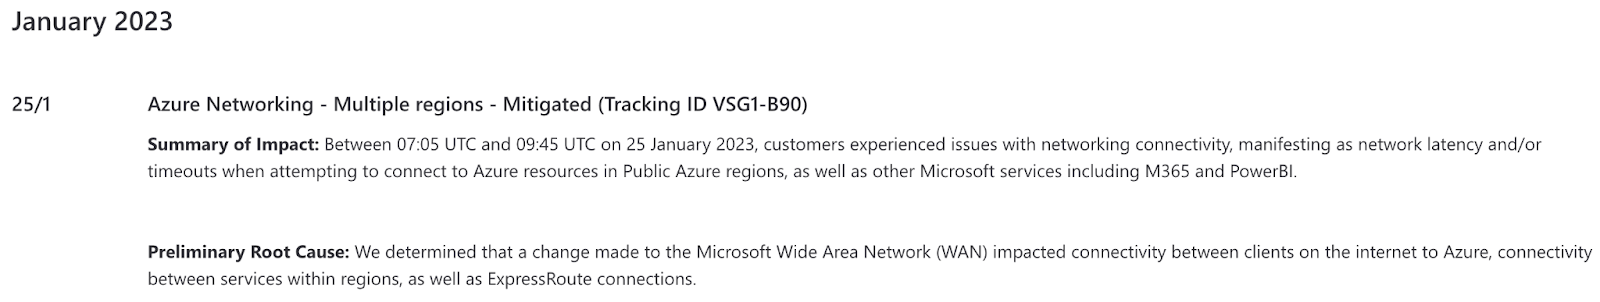
According to the Microsoft Azure status page, the outage was reported at 7:05 UTC until 9:45 UTC, which correlates to the ZDX data above. However, Microsoft services started to recover pretty quickly, by 12:20 a.m. PST, and Microsoft reported the issue resolved by 1:45 a.m. PST.
With ZDX Alerting, our customers were proactively notified about end user problems, and incidents were opened automatically with our ServiceDesk integration long before users started to report it. From a single dashboard, customers were able to quickly identify this as a Microsoft routing issue, not an internal network outage, saving precious IT time.
Source: Microsoft
Zscaler Digital Experience successfully detected a Microsoft Azure outage along with its root cause, giving our customer the confidence that it was not a single location, their networks, or devices, averting critical impact to their business.
Try Zscaler Digital Experience today
ZDX helps IT teams monitor digital experiences from the end user perspective to optimize performance and rapidly fix offending application, network, and device issues. To see how ZDX can help your organization, please contact us.


