
As hybrid work culture continues, troubleshooting end user experience needs to be easy, but it can be a challenge unless you have the right tools. On the front lines, network operations and service desk teams face plenty of tickets around slow application response times. The real challenge is how to quickly resolve them.
Many people resort to Google for answers. So, let’s try that.
When you search for “slow application,” one result is “How do I fix slow running apps?” Right away, going down this path without end user experience context might be a waste of time—it’s better to have full context before diving into an end user’s problem. As you can see below, rebooting is the first recommendation, but it might not fix the problem if the device isn’t the root cause.
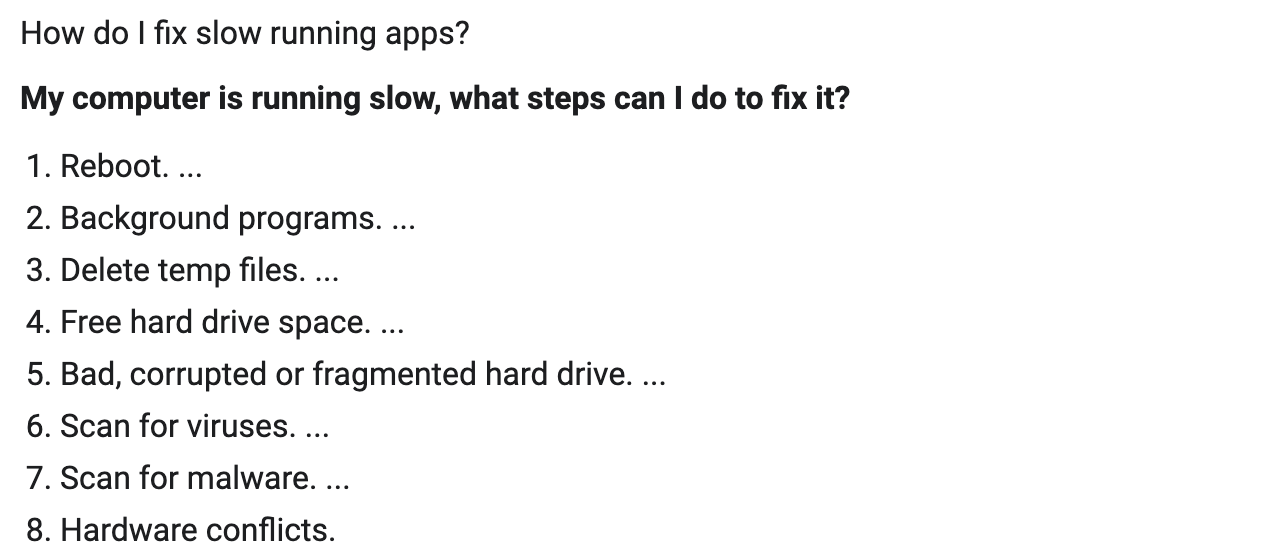
Source: Computerhope
Zscaler Digital Experience (ZDX) allows network operations and service desk teams to quickly help users even when they’re not on the corporate network. Employee Wi-Fi issues are common, so let's walk through quickly detecting such an issue with ZDX. Keep in mind that Wi-Fi issues can result in slow application response times.
Imagine a user reports an issue to the service desk team about slowdown when accessing Salesforce and other apps while working from home. Let’s walk through the troubleshooting steps using ZDX.
- Log in to the ZDX console.
- Under User Search, enter the name of the user with the issue, and select the user.
- On the User Page, select the time range the user reported the issue and select the Salesforce application.
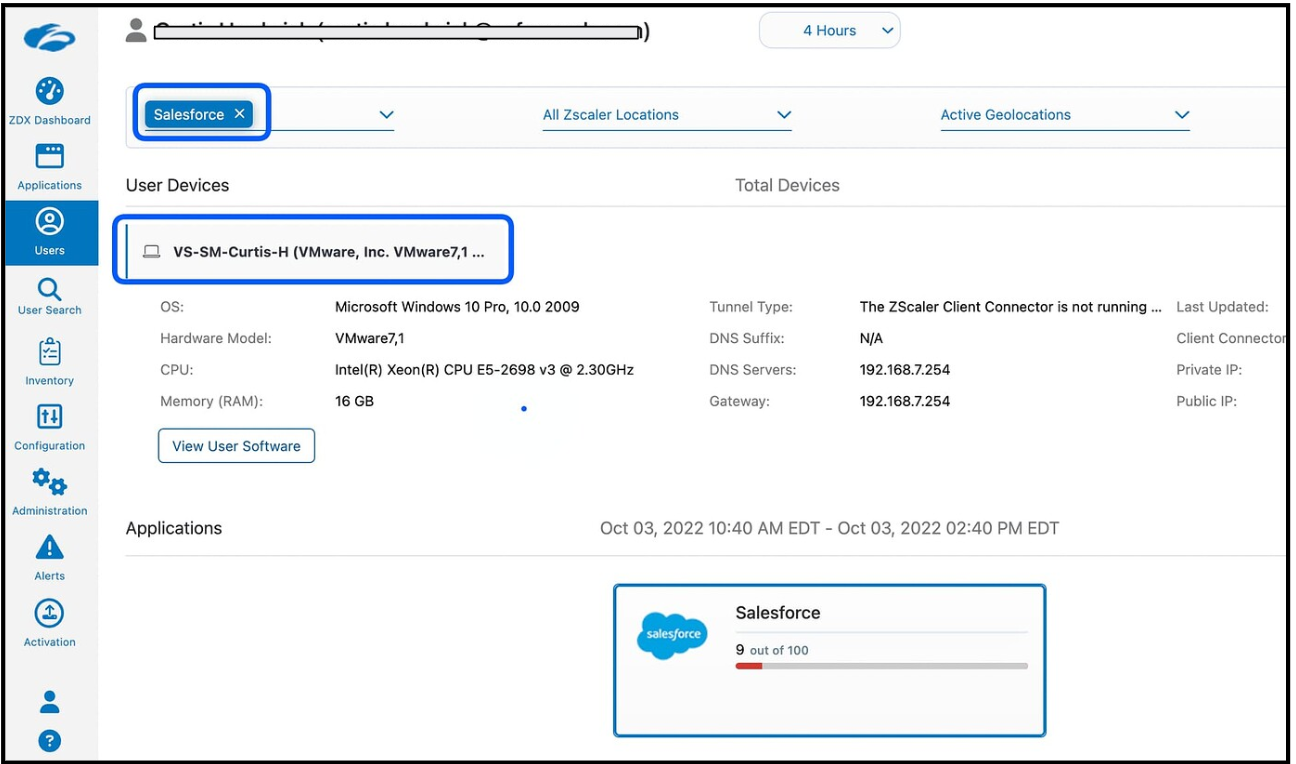
Quickly find the troubled user in the ZDX Dashboard
4. Click on the time the user reported the problem. This will highlight the details in the following charts. ZDX Automated Root Cause Analysis also suggests potential issues by looking at telemetry data.
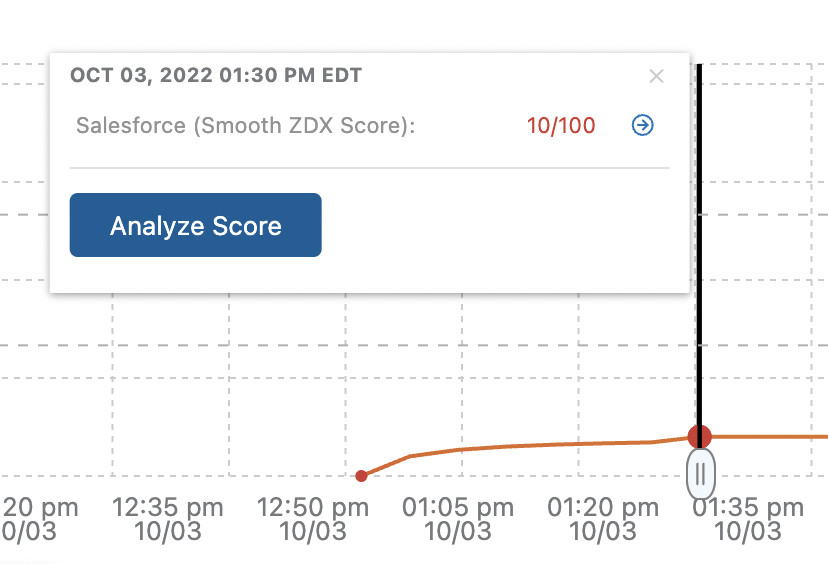
ZDX Score represents all users, apps, and locations in your organization

ZDX Automated Root Cause Analysis analyzes the issue
5. Look at the Page Fetch Time, Server Response Time, and DNS Resolution Time to verify if the user is having trouble. In this case, you’ll notice everything is slow!
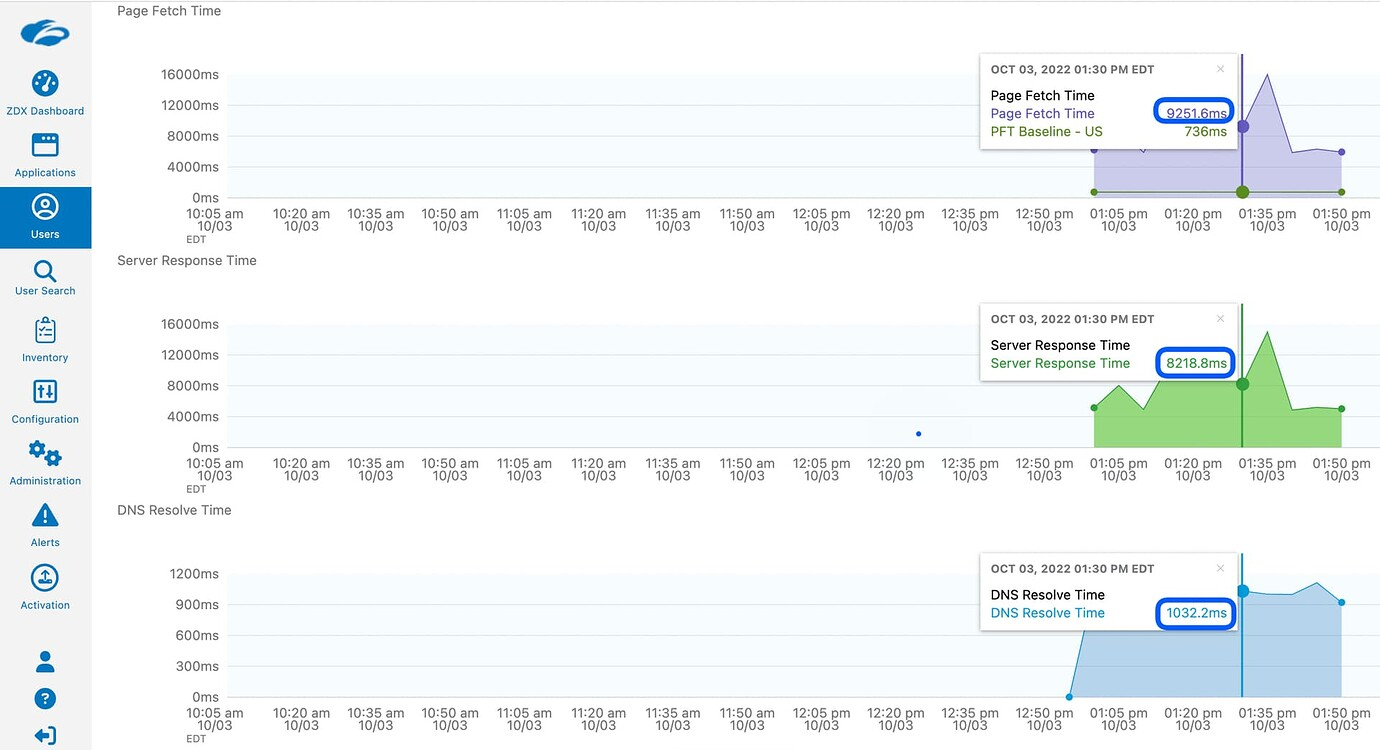
An intuitive dashboard to quickly see response times
6. Scroll down to Cloud Path and review the Wi-Fi signal bars and latency. In this example, note the high latency between the end user’s device and the Wi-Fi router.

ZDX shows hop-by-hop analysis to visually identify issue
7. If you hover over the user’s device, you will see the type of Wi-Fi they’re connected to. In this case, the user is connected to the 2.4Ghz spectrum (which is slower than 5Ghz).

Detailed end user device information
8. Additionally, you can check the Wi-Fi signal’s strength over time. Here, you can see the signal strength is 62%, and it wasn’t available for a period of time.
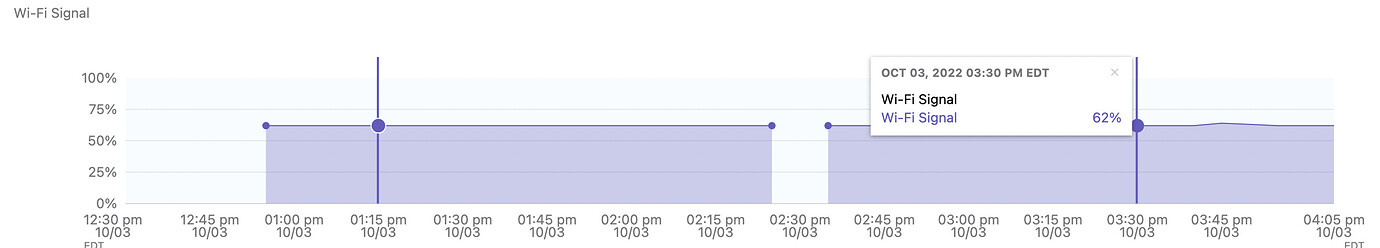
Granular Wi-Fi signal strength details
As you can see, there’s an issue between the user’s device and the Wi-Fi router. Now that you have more context, you don’t have to start by rebooting the device. Instead, you could ask the user to move closer to the router or check for anything interfering with the Wi-Fi signal. Additionally, Cloud Path eliminates issues in the network beyond the Wi-Fi router to the application. This significantly reduces troubleshooting time.
To solve tickets faster, take a look at how ZDX can help. Sign up for a demo and see for yourself!


