
In talking to hundreds of IT professionals over the past 12 months, it’s clear that many organizations are faced with similar challenges when it comes to keeping employees productive.
In our most recent poll from a workshop, network and service desk professionals identified the following as their most challenging issues:
- 83% reported they lack visibility into their user’s home Wi-Fi or last-mile ISP
- 17% reported they have too many escalations for basic networking questions
When asked how they plan to resolve these issues, respondents reported the following:
- 67% want detailed network metrics such as hop-by-hop view with latency and packet loss
- 33% want end user device details such as process, memory, and CPU information
We will take a look at how organizations can meet these challenges, but first, we must understand how to holistically monitor IT environments and remove monitoring silos.
It’s well understood that many organizations have separate monitoring solutions for devices, networks, and applications, which, in some cases, could lead to these organizations to house as many as 40 monitoring tools. As we dig further into how these monitoring tools are used, we’re surprised to learn that many of these tools or features aren’t used at all! However, IT teams aren’t willing to consolidate tools unless a new solution has improved capabilities. This is where AI plays a role.
Gain full visibility across your entire organization
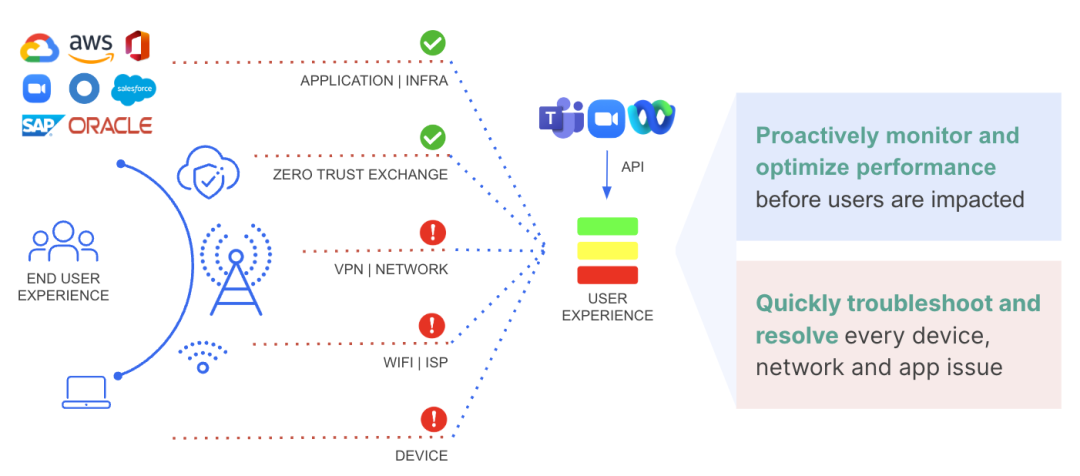
Zscaler Digital Experience™ (ZDX™), gives you a complete view of your devices, networks, and applications to ensure optimal digital experiences for all your users, no matter their location. ZDX can provide a full end-to-end view of performance and availability across the entire application delivery chain.
Reduce tickets with AI-assisted self service and comprehensive network monitoring
To reiterate the above, 83% of IT professionals lack visibility into a user’s home Wi-Fi. The challenge is that users connect in from various locations, making it difficult for IT teams to triage issues. Additionally, users leverage various types of Wi-Fi networks and expect that IT will solve issues no matter where they’re located. There are two key aspects to solving this problem. First it’s about reducing the burden on IT teams, and second, it’s about giving the IT teams the insight they need to dive deeper if the situation requires.
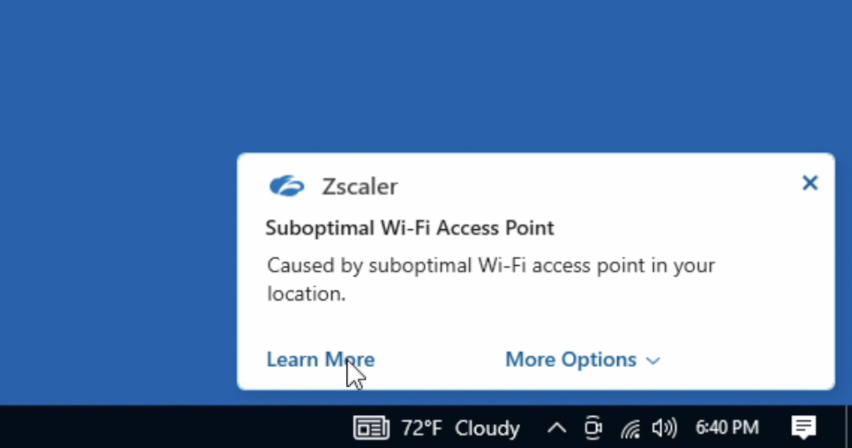
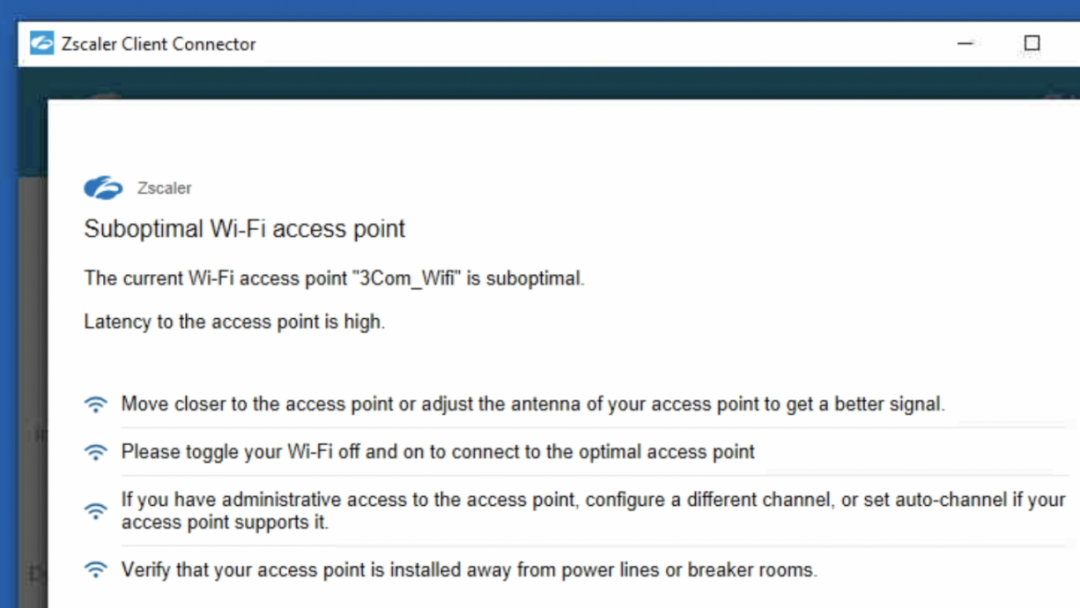
ZDX empowers users to fix problems that impact their digital experience, if it’s under their control. A lightweight AI engine runs in the Zscaler Client Connector and notifies the user of issues such as poor Wi-Fi or high resource utilization, and then offers ways to resolve the issue, resulting in reduced tickets.
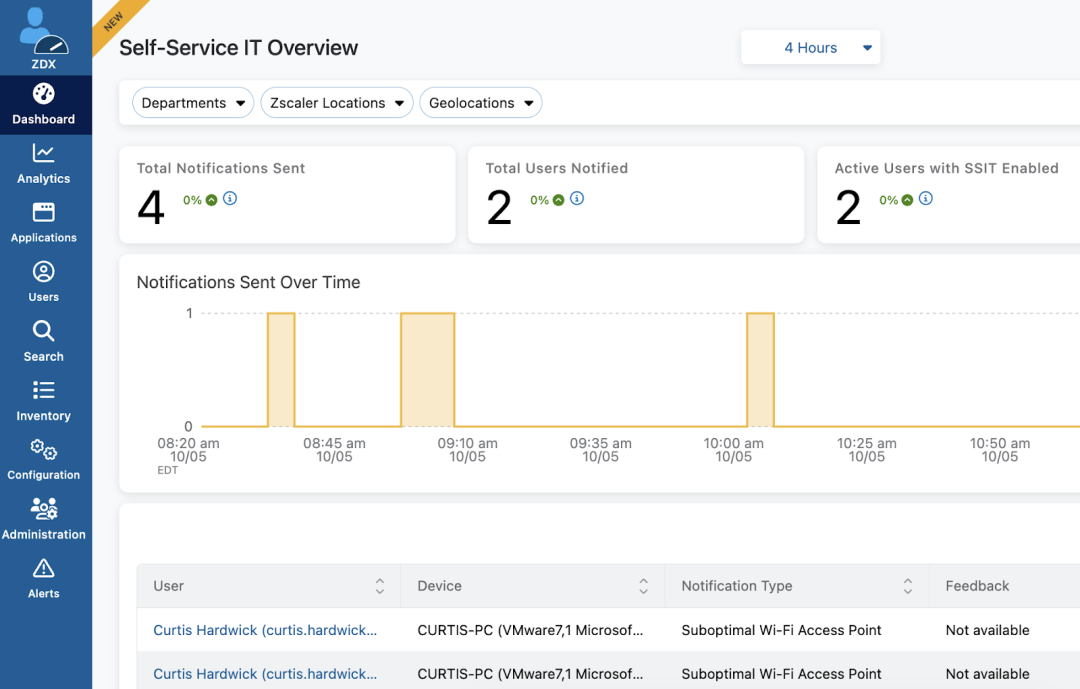
In addition to the user notification, the ZDX administrator can see all the notifications sent and take action if needed.
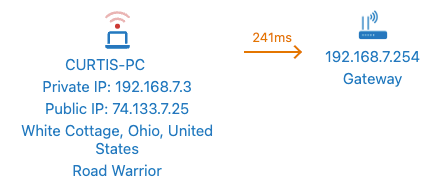
ZDX provides deeper visibility into each end user's devices as well as the network path highlighting connectivity from an end user’s device to the application. This helps Network Operations teams triage complex issues which could be related to the type of connector, Wi-Fi bands, or simply the Wi-Fi signal strength.
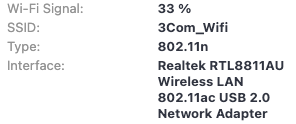
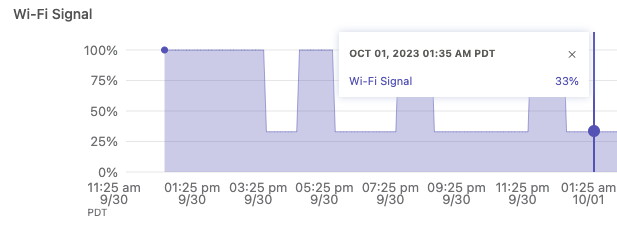
ZDX helps IT teams quickly find detailed information about a user’s connectivity from a single dashboard. IT teams can filter based on when an issue was reported to see metrics such as Wi-Fi signal strength, SSID, type of connection, and interface. These metrics are instrumental in identifying whether a user switched between wireless connections or if there are problems with a certain wireless card, which may require a firmware update. With detailed metrics, IT teams can dig in further without disrupting end users with basic questions and get them back to work faster.
Proactively resolve last mile ISPs and intermediate ISPs issues
The hybrid workforce has tasked network teams with managing thousands of networks versus only one, as they did previously, including home networks. That said, this is today’s norm, which means they have to manage hundreds of ISPs from last mile to intermediate. The next hop in the path after local Wi-Fi is the last mile ISP. This is typically the internet provider for a user’s home hotel connection. Network issues can also expand into branch locations when users come into the office to work, and managing various networks with multiple providers can quickly become unmanageable..
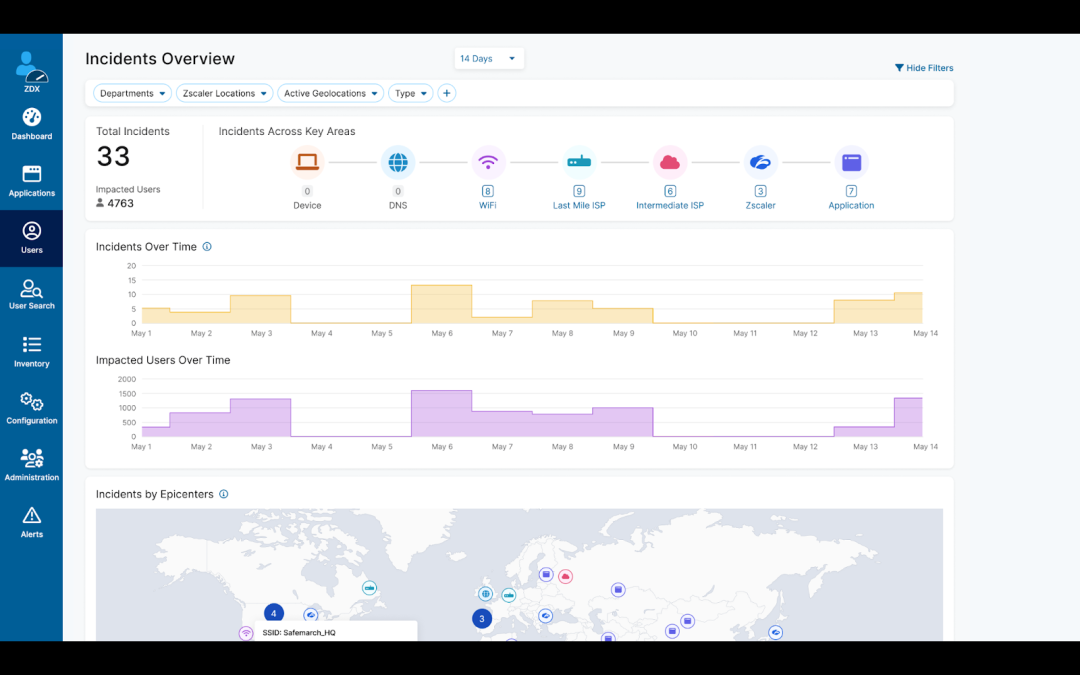
The ZDX Incident Dashboard includes ML-generated last mile ISP and intermediate ISP models to detect potential application, Wi-Fi, Zscaler data center, and endpoint issues with automated AI-powered correlation. This enables Network Operations to quickly and efficiently find root cause and focus on restoring reliable connectivity. ZDX looks across billions of signals collected from as many probes alongside petabytes of telemetry data points to understand root cause and pinpoint issues, benefitting all ZDX customers, no matter the size.
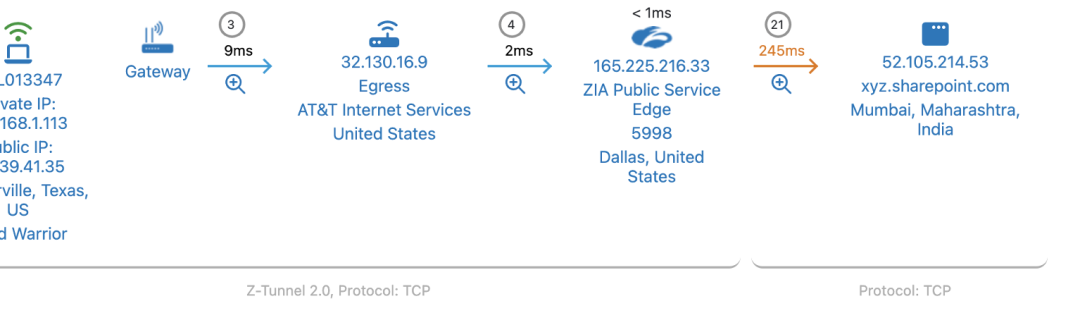
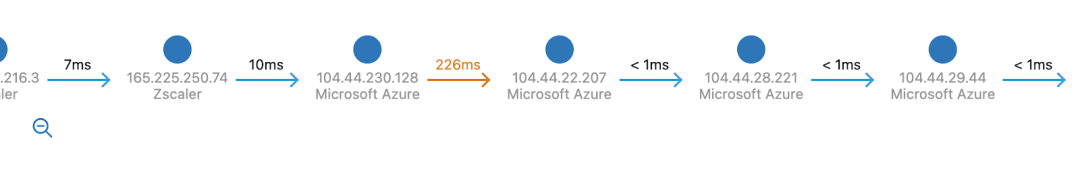
Dive deep into network paths with hop-by-hop metrics
Our poll indicated 67% of IT professionals want detailed hop-by-hop metrics with latency and packet loss information. Many network professionals have traceroute at their fingertips to help pull hop-by-hop metrics, which can be accomplished at the router or switch without disrupting the end user. However, if you want end user details, you must get access to their machine. This takes time and coordination, and by then, the issue may already have been resolved.
ZDX helps network teams visualize where network paths may be causing performance issues as it continuously collects data from the endpoint. This allows network teams to go back and review when a user was having an issue. Network teams are given the power to track metrics across Wi-Fi, local ISPs, and corporate networks to easily spot latency or packet loss between hops.
Unify monitoring silos with AI-powered intelligence
IT leaders want intelligent solutions to help assist their Network Operations and service desk teams and keep users productive. That said, they also want to consolidate their monitoring tools. It can be time consuming to sift through multiple dashboards and correlate details for device, networking, and application issues, which not only increases end user frustration but also jeopardizes SLAs around ticket resolution. Learn more about how ZDX is solving these issues by requesting a demo today!


