
Boost Productivity with Digital Experience Monitoring
Rapidly detect and resolve app, network, and device issues.

Optimize user experiences across all locations, devices, and apps
Your users and apps are everywhere, and poor performance can impact their productivity. Monitor performance to detect last-mile and intermediate ISP issues, remediate device issues, and resolve app slowdowns to ensure flawless end user experiences.

Get unified visibility across devices, networks, and apps

Detect issues early and quickly pinpoint root causes using AI

Collaborate effectively using data across IT operations, support, and security teams
The Problem
Poor technology experiences have serious consequences
Your users rely on 24/7 access to apps, data, and services—any slowdowns or outages can harm productivity, user engagement, and the customer experience. Unfortunately, legacy DEM solutions fail to provide IT with full visibility across devices, networks, and apps in today’s zero trust environments.
68.6%
EMA PUBLIC REPORT
74%
ENTERPRISE MANAGEMENT ASSOCIATE
40%+
TECHINTELPRO
Product Overview
Ensure great user and customer experiences across all locations, devices, and apps
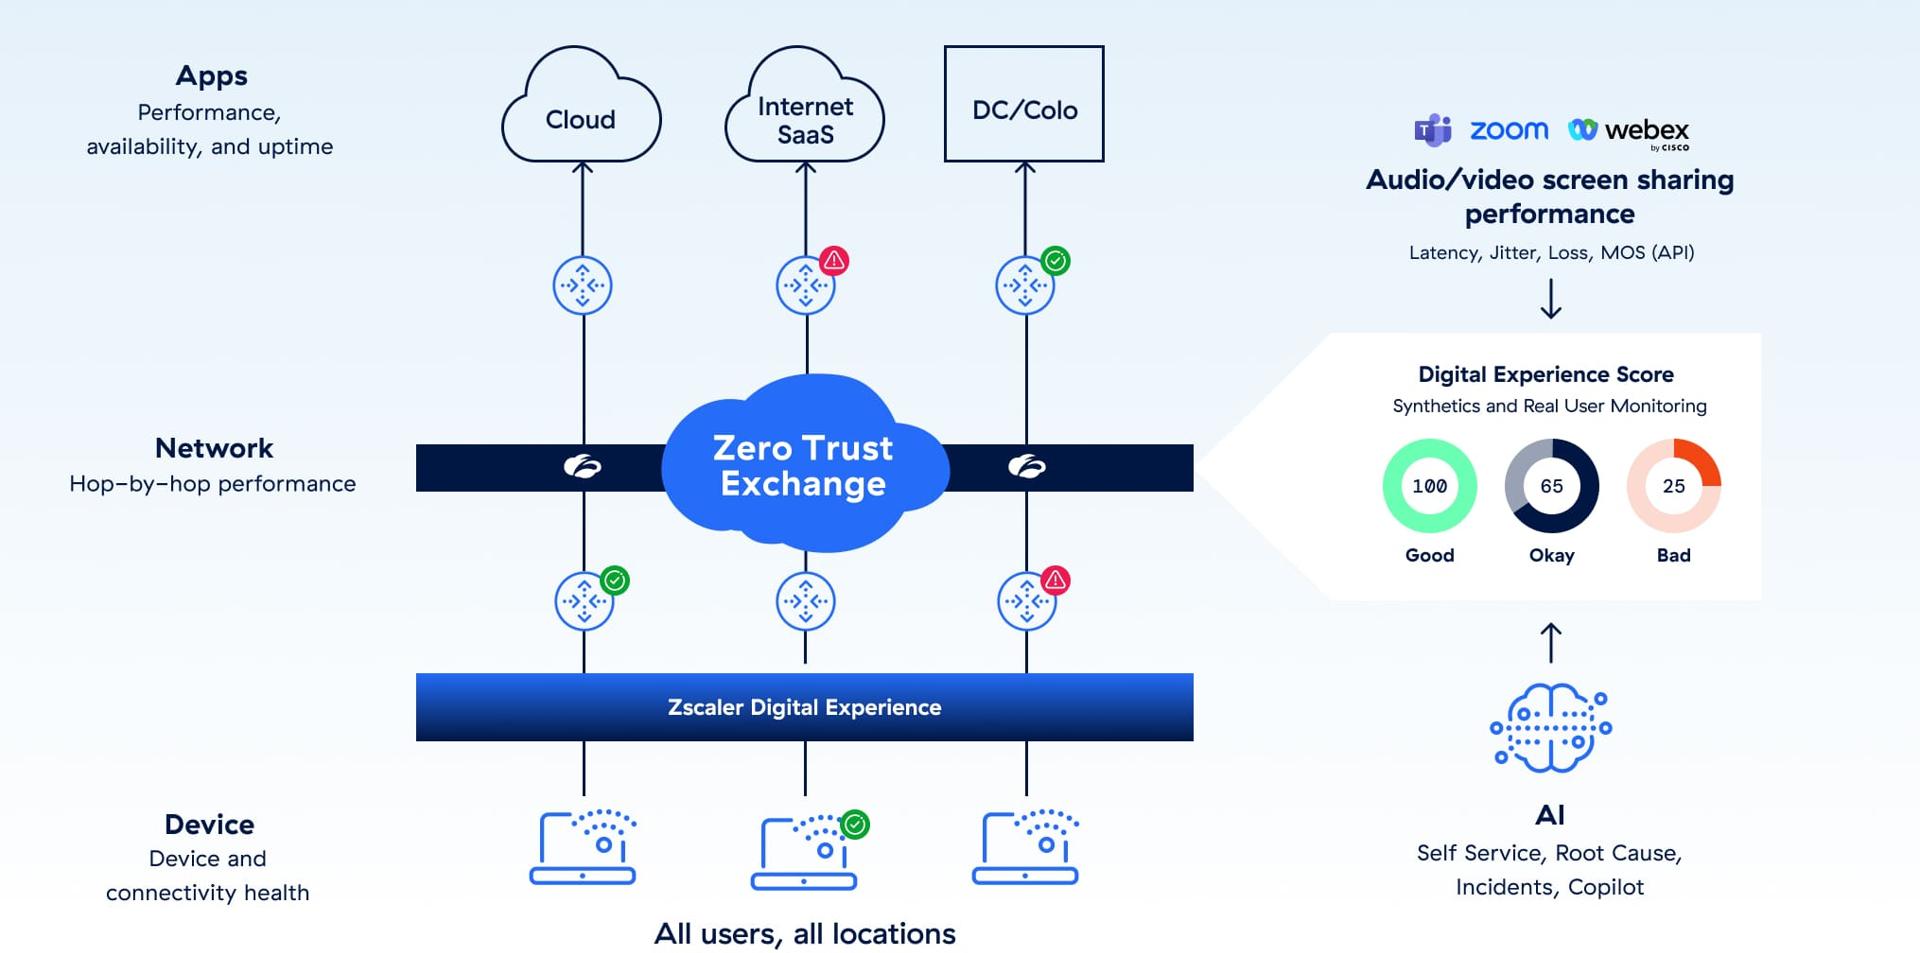
Zscaler Digital Experience™ (ZDX) boosts productivity with end-to-end visibility from user devices across any network to SaaS, cloud, and data center apps. By unifying AI-powered root cause analysis with deep telemetry from device health, network path, and synthetic and real user journeys, IT teams can quickly detect and resolve issues anywhere.

Detect problematic ISP issues 98.2% faster

Save $400K by rerouting 1K+ users to bypass ISP issues quickly

Avoid $500K+ in productivity loss by identifying 14K BSODs, 10K audio failures, 50K browser crashes in 30 days
Discover the latest ZDX innovations
Detect, diagnose, and remediate user performance issues faster with AI.
Visibility from device to app
Continuous real-time performance analysis across your enterprise.
Turn 500B+ daily transactions into instant resolutions with ZDX Copilot
Use unrivaled, full-stack telemetry—from device health to last-mile ISP performance—to instantly answer troubleshooting questions in natural language.
Benefits
Make work easier for users and IT

AI-driven end-to-end analysis
Pinpoint root causes in seconds with AI/ML analysis from device and local Wi-Fi, across the ISP, through the Zscaler cloud, to the app.

Eliminate agent sprawl
Reduce cost and complexity of management by consolidating security and monitoring into a single endpoint agent.

ISP detection & remediation
Detect and bypass global ISP outages instantly by rerouting traffic around problematic ISPs
Product Details
Monitor User Experiences
Understand the digital experience of your apps and services from your users’ point of view.

Key offerings
Get global views of user satisfaction by combining synthetics and real user monitoring metrics. Drill down by regions, departments, and users.
Review each user’s score along with causes of poor experiences using AI.
Get alerts via email, IM, and tools like ServiceNow when anomalies are detected.
Detect Widespread Device Events
Maintain a complete picture of the devices and software in your organization. Get detailed insights for each device, no matter where it is.

Key offerings
Proactively address device issues with a consolidated view of struggling devices across your organization.
Dedicated dashboards for critical events such as software crashes and system crashes (including BSOD).
Resolve recurring device issues by remotely running custom or prewritten scripts on single or multiple devices for one-click remediation.
Optimize costs and resource allocation by identifying under-provisioned devices that hinder performance and over-provisioned devices that inflate spend.
Diagnose & Remediate Network Issues
Maintain visibility across networks—even those not in your control—to support users no matter where they work.

Key offerings
Baseline network performance and detect anomalies to resolve issues 98.2% faster by rerouting users to one of 160+ global Zscaler datacenters to avoid problematic ISPs.
Track latency and packet loss across multipath networks with detailed path visualization, analyze hops, identify top ISPs, and enable remote packet capture for troubleshooting.
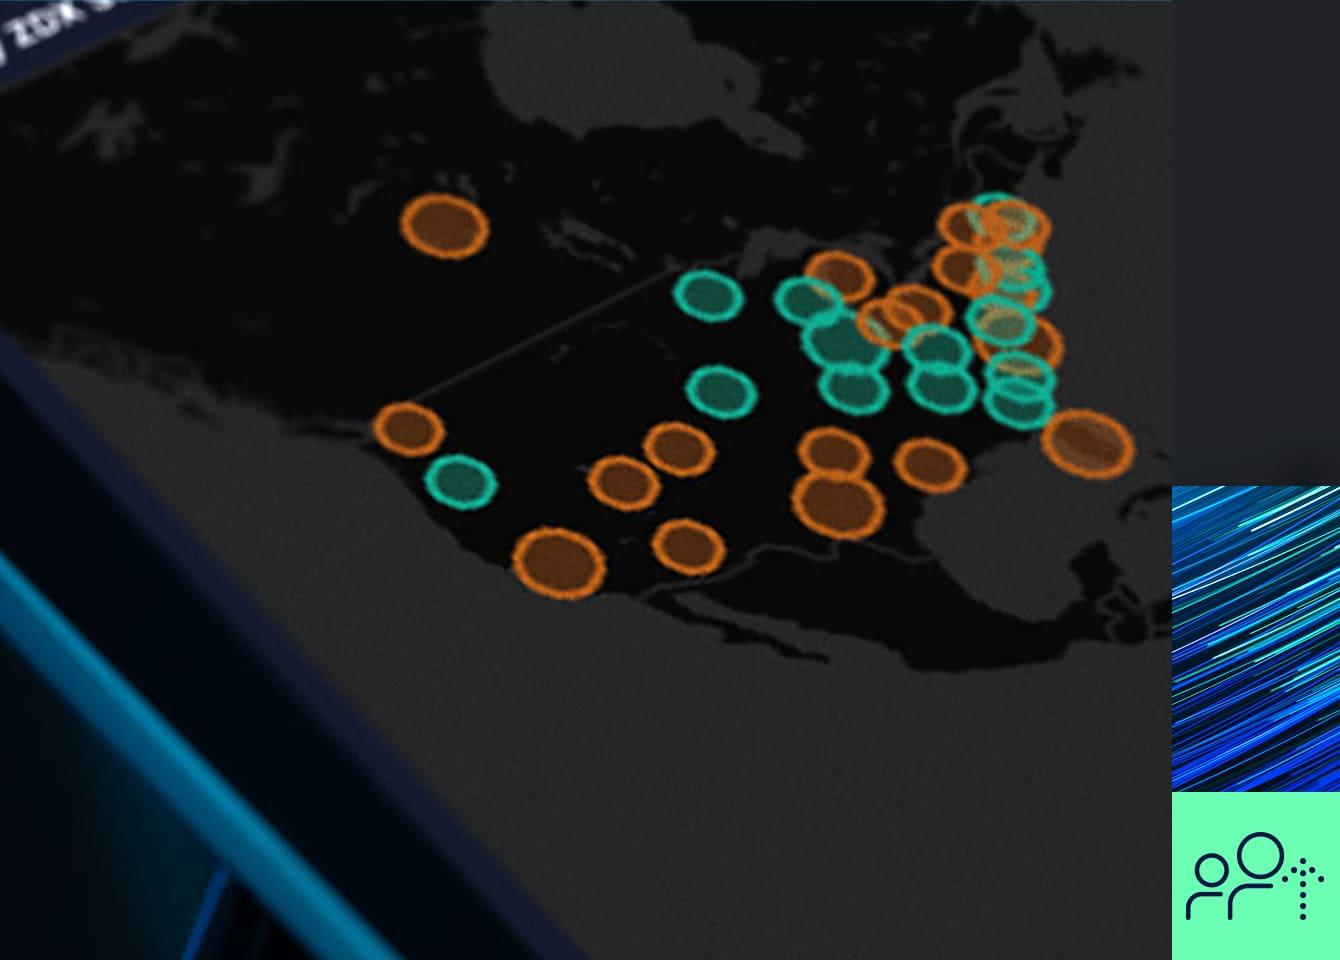
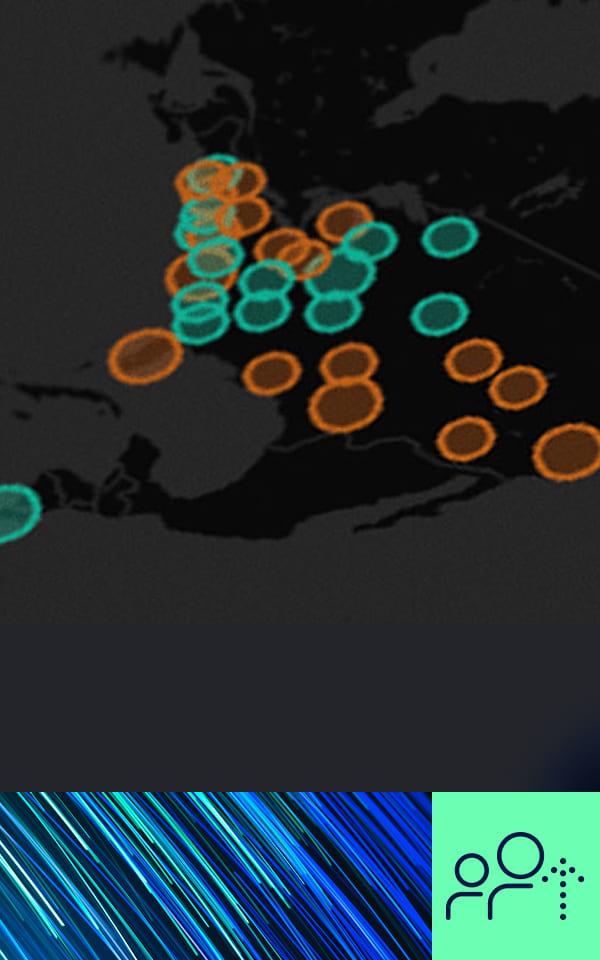
Gain visibility into peer insights to identify whether other Zscaler customers are experiencing the same network anomaly (e.g., ISP, region), to pinpoint if the issue is widespread.
See how ISP issues like blackouts, brownouts, and high latency impact user experience.
24/7 SaaS & Web Application Monitoring
Monitor apps from user devices and global locations to ensure users get uninterrupted service.

Key offerings
Capture real performance data from actual user sessions to get insights into how applications behave across devices, browsers, networks, and usage scenarios.
Observe apps running in your data center or cloud in addition to SaaS. Understand page fetch and DNS times.
Monitor Microsoft Teams, Zoom, and Webex meeting experiences to identify root causes of poor call quality.
Monitor availability and performance of apps and services 24/7 from globally distributed locations.
AI-Powered Operations
Instantly expose root causes using AI, and help users get back to work more quickly.

Key offerings
Quickly isolate root causes in devices, Wi-Fi, security services, networks, or apps.
Use unrivaled, full-stack telemetry - from device health to last-mile ISP performance - to instantly answer troubleshooting questions in natural language.
Integrate with ServiceNow or via our API to create tickets and support triage, analysis, and resolution.
Empower end users to fix issues within their control, such as poor Wi-Fi or high resource usage, with user-friendly, AI-powered guidance.
Get Global Insights
Review the impact of digital experience initiatives on employee productivity. See trends and seek opportunities to optimize.

Key offerings
Report on performance trends with built-in or custom templates. Combine, correlate, and visualize insights from diverse datasets.
Generate slide decks for cross-functional team meetings. Set goals and take steps to further optimize digital experiences.

Choose the right ZDX plan for your needs
Use cases
Empower and enable your entire workforce

Quickly detect and address user experience issues to keep users productive no matter where they are. Reduce mean time to resolution with AI-powered root cause analysis and insights.

Get an integrated view of application, network, and device health. Plus, get deep insights into audio, video, and sharing quality of Microsoft Teams, Zoom, and Webex calls.
 visibility")
Only with ZDX, get end-to-end visibility in zero trust environments to optimize performance and rapidly fix user experience issues affecting productivity.

Understand the performance and availability of critical apps like Microsoft 365 or Salesforce, and ensure that SaaS vendors meet service level agreements.
The Zscaler Platform
The cybersecurity platform for the AI Age - built on Zero Trust to protect users, workloads, branches and devices through the world’s largest inline security cloud.

Data Security
Secure data everywhere, with comprehensive visibility and controls across all channels.
AI Security
Embrace AI with confidence using Zscaler AI Protect, a unified solution to secure AI at scale.
Agentic SecOps
Draw on insights from the world’s largest inline security cloud and third-party sources to assess risk and detect and contain breaches.
Customer Success Stories

Main Line Health Adopts Zero Trust and Unified Data Security to Support Resilient Continuity of Care

Molson Coors puts great user experiences on tap

Scandinavian Tobacco Group Secures Its Growing Global Operations on the Zero Trust Exchange
