As we discussed in our announcement blog, Zscaler is continuing efforts to empower IT Operations and Service Desk teams to deliver flawless digital experiences. Many organizations are still struggling to support a distributed workforce, as users and data continue to put a strain on IT departments with already limited time and resources. In order to drive better outcomes, IT must have intelligent tools at their disposal to efficiently troubleshoot internet connectivity, accelerate Mean Time To Resolution (MTTR) through precise AI-powered issue detection, and root cause analysis, and expand and support the digital workforce quickly and confidently.
Maximize digital dexterity with global insights
The internet is now the new corporate backbone, and it is vital to quickly gain insights to improve end user productivity from anywhere. Network operations and service desk teams need simple intuitive solutions across the enterprise to monitor ISPs, internet, transport, unified communication solutions, and more. However, it’s not only important to monitor and triage issues but to also understand repetitive issues across the enterprise so they can be addressed.
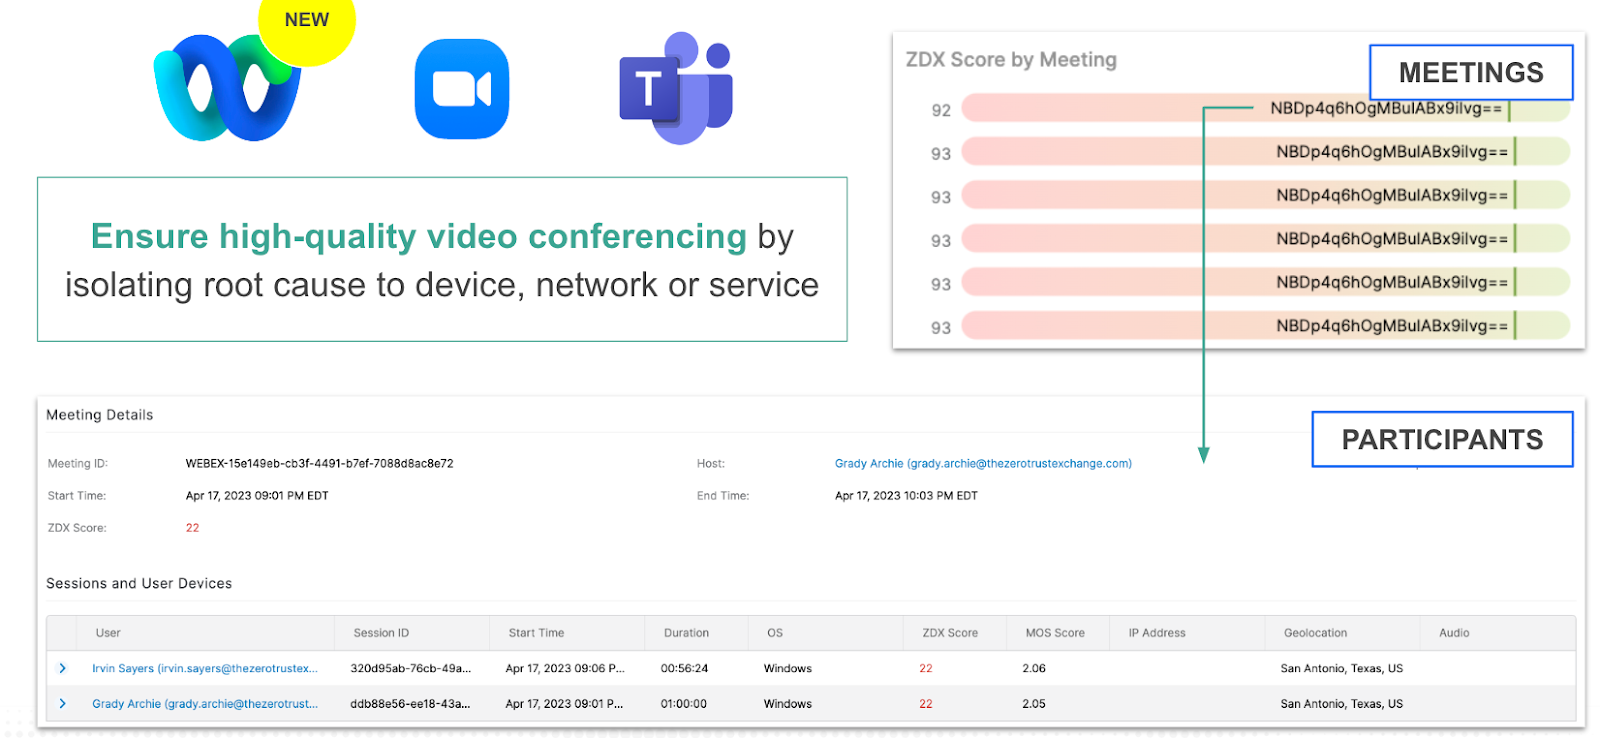
1. Monitor quality of WebEx meetings: Webex call quality is our new addition to the already existing UCaaS monitoring capabilities of Zoom call quality and Teams call quality monitoring. This new capability enables you to monitor your users' Webex meetings; among two or more participants. This integration provides real-time visibility into their meeting experience. The ZDX score for call quality can reflect either a Mean opinion score (MOS) average, or metric thresholds for latency, jitter, and packet loss. Call quality works in parallel with cloud path probes and device metrics and events to help you identify issues that are unique to a device or the network.
Call quality data is retrieved using the Webex API, and data is captured in real time as a meeting is in progress. This enables your support teams to quickly get to the root cause of an ongoing issue in a meeting or a past meeting where the user experienced problems.
ZDX with integrated Webex insights
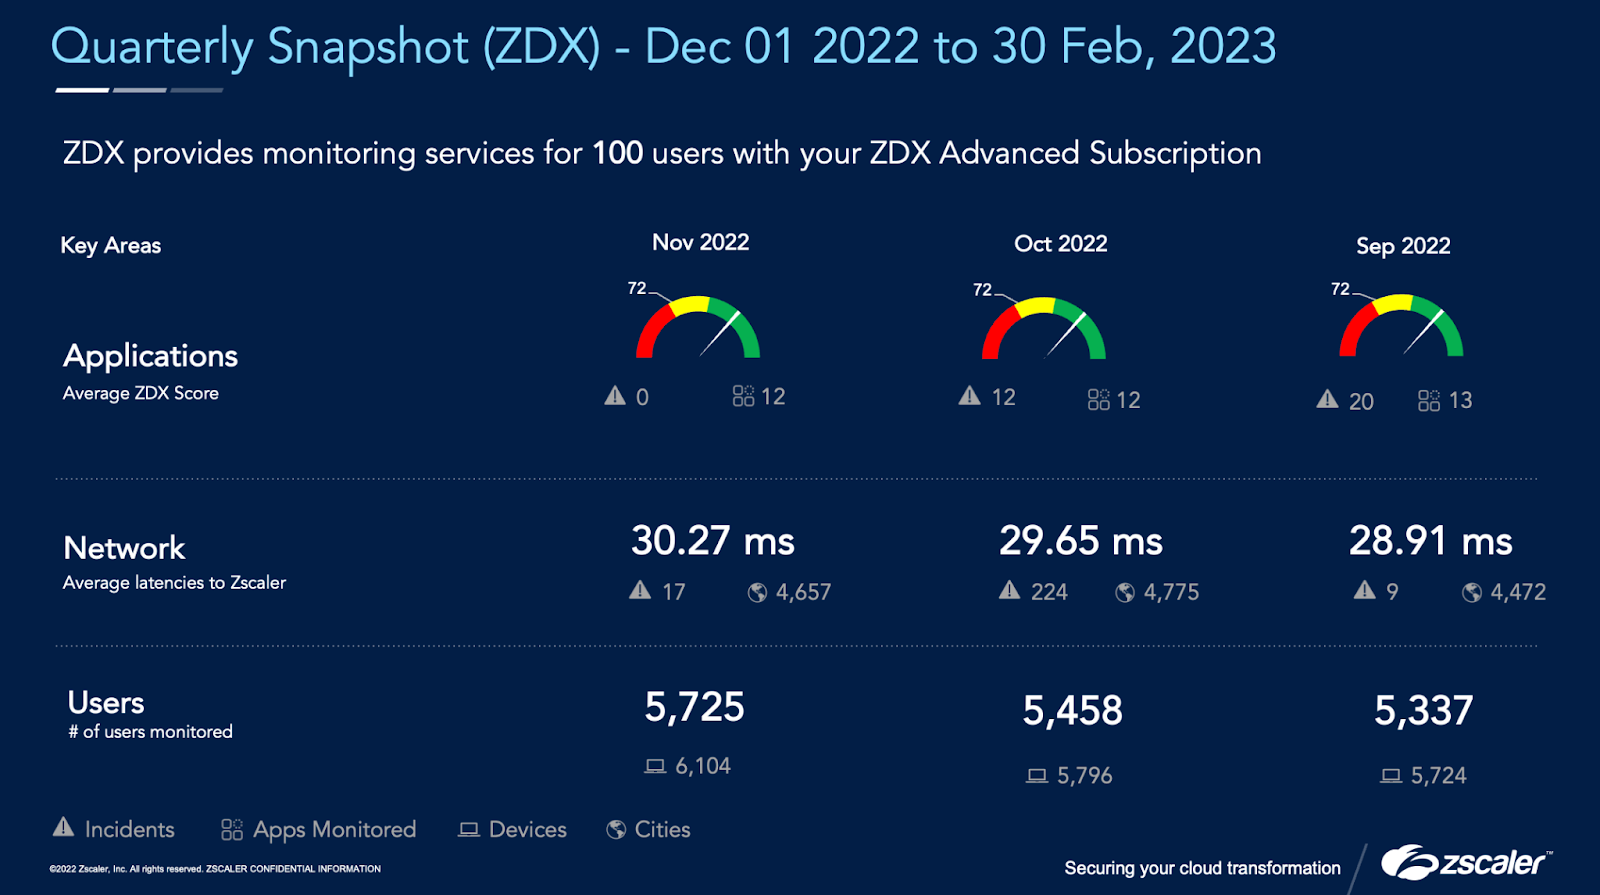
2. Quarterly insights for productivity reviews (QBR): ZDX quarterly business report (QBR) provides executive and operations teams comprehensive analysis about the organization’s end user, application, and network experience while providing them key insights into their business to take action.
The QBR report provides trend analysis on users’ ZDX score, applications experience, ISP information, DNS performance, network latency, alerts, and much more.
It also provides you with insights into your user Wi-Fi connectivity and detailed outlines about configured application scores across various geographical regions.
ZDX Quarterly Business Reports showing enterprise insights
Achieve faster IT resolutions using AI
To accelerate MTTR, ZDX leverages AI and ML to automate root cause analysis to eliminate fragmented data, finger pointing across IT teams, and alert fatigue. Furthermore, with AI-powered analysis and dynamic alerts, IT teams can quickly compare optimal versus degraded user experiences and set intelligent alerts based on deviations in observed metrics. Read more in this AI ebook.
1. Automated root cause analysis (ARCA): ZDX can quickly identify the root cause of user experience issues with AI-powered root cause analysis capability. It spares IT teams the labor of sifting through fragmented data and troubleshooting, thereby accelerating resolution and keeping employees productive. Watch this video to see it in action!
ZDX One-click automated root cause analysis
2. Perform AI-powered analysis: ZDX ARCA has multiple modes which can be leveraged to dig deeper into the issue. ARCA has three modes: single point score, range mode, comparison mode.
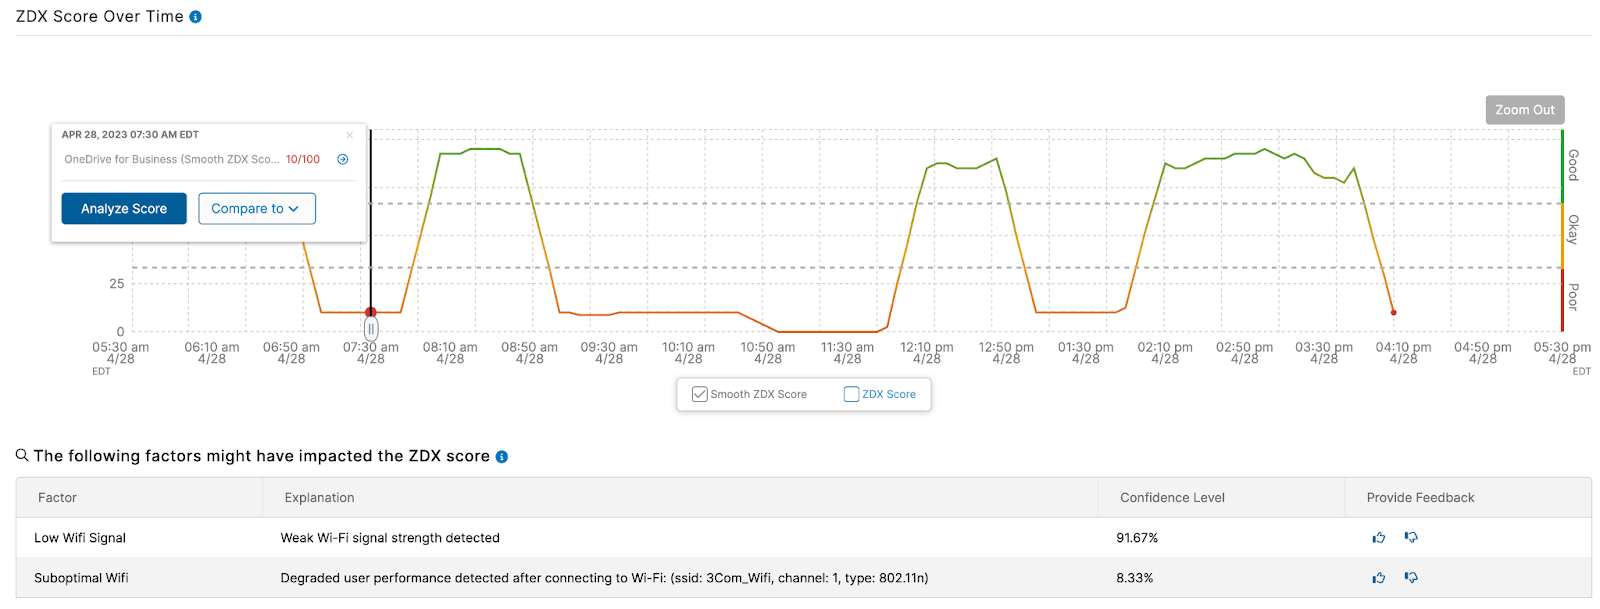
Single point in time mode: Allows you to select a specific point on a low ZDX score and run an analysis on what could have caused the score to dip at the specific time, which provides insight into what’s going on with an end user’s experience in a matter of seconds.

ZDX single point mode analysis
Time range mode: allows service desk teams to select a time range and get the two most common problems across the specified time range.
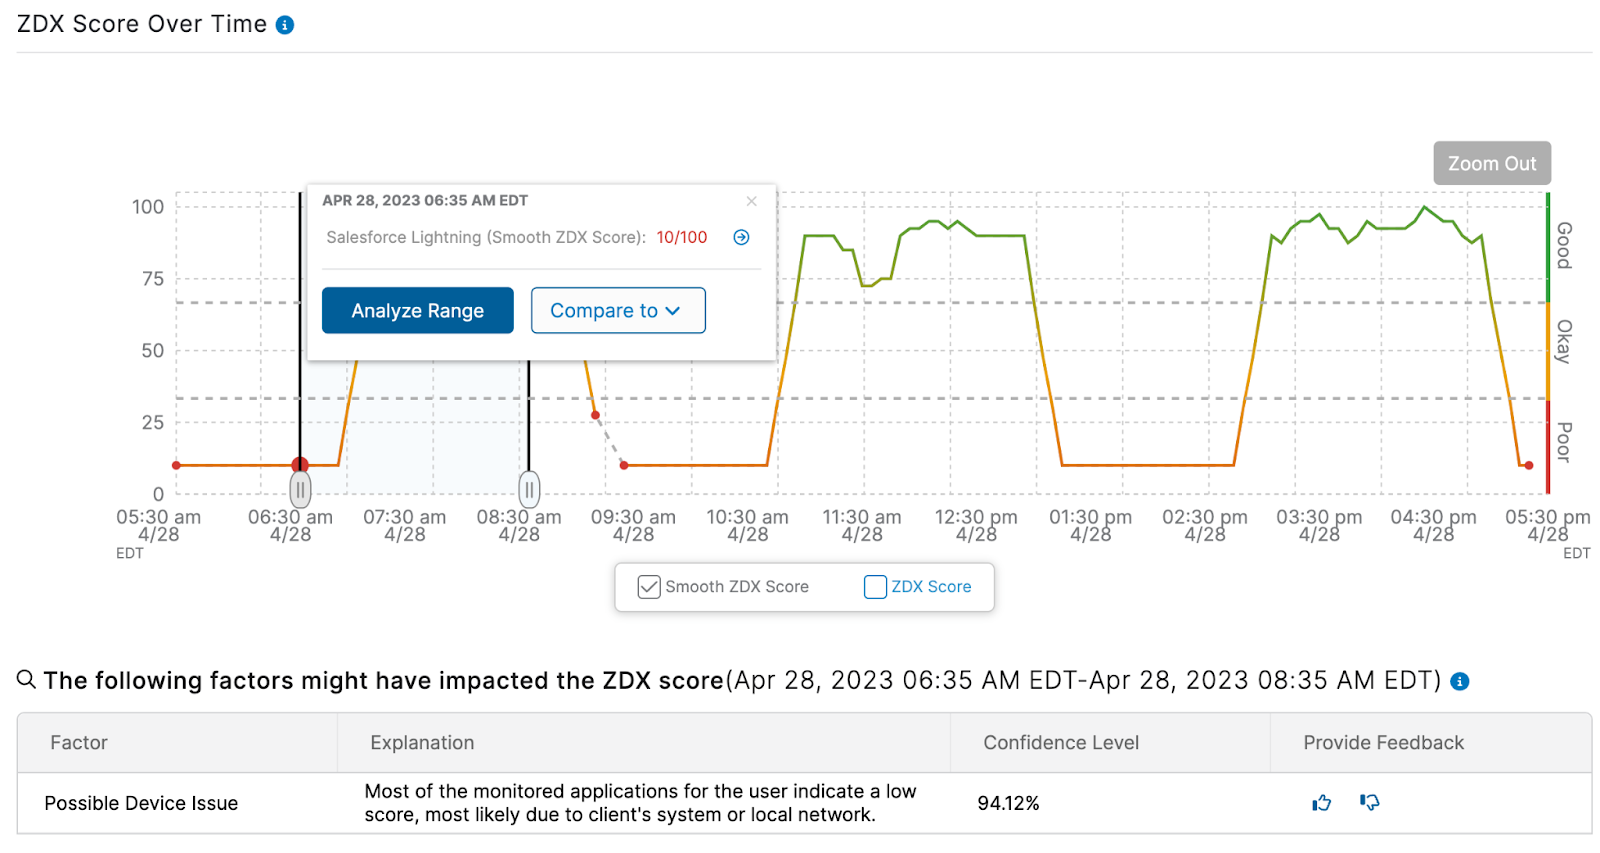
ZDX range mode analysis
Comparison across time mode: compares two points in time to understand the differences between the points. This function determines a good versus poor user experience. It visually highlights the differences between application, network, and device metrics.
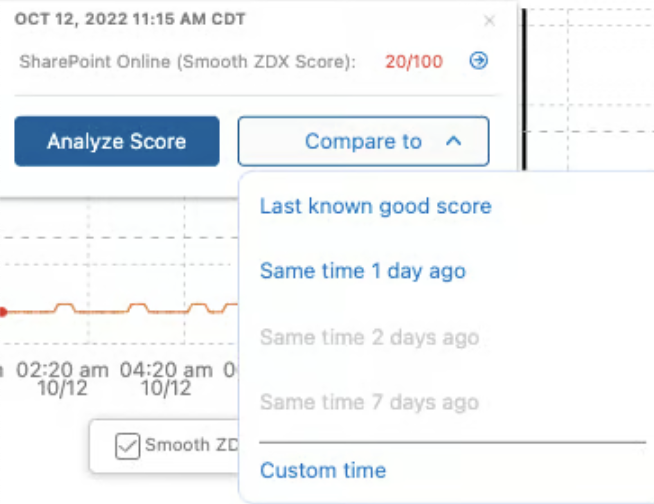
ZDX compare two points
3. Dynamic alerting to reduce alert fatigue: With ZDX score as a metric, customers can set up criteria for ZDX score as a metric for a particular application and a probe. If there is a significant latency increase to reach a certain application, it is accounted for in the score drop.
The new ZDX score drop metric for an alert type enables the user to set the threshold sensitivity (low, medium, high). This enables customers to reduce the number of alerts and focus on major deviations observed in their ZDX score baselines.
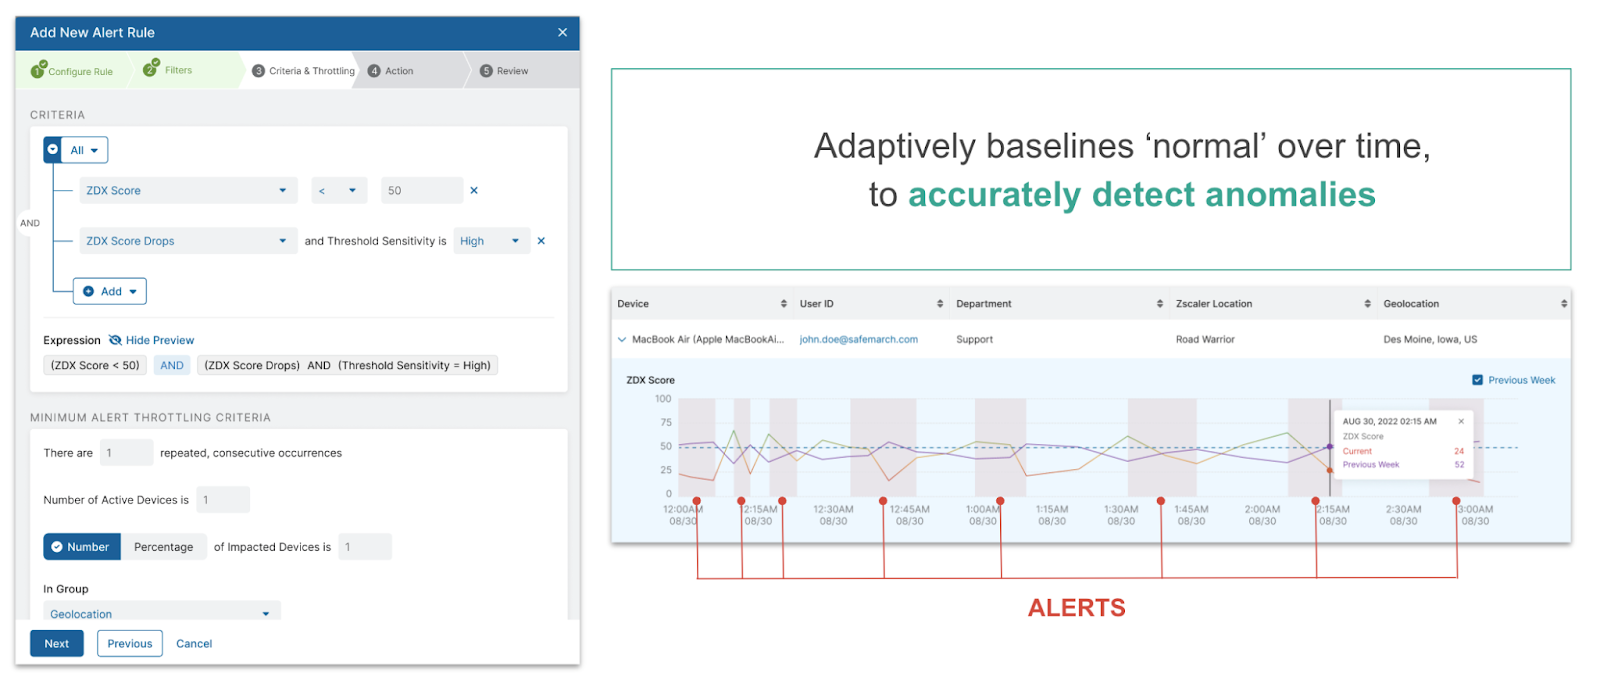
ZDX dynamic alerts
Effortlessly scale your global enterprise
Desktop support teams often struggle to resolve device issues for remote workers across regions globally. ZDX offers a range of key metrics including device health and active processes, OS metrics for ChromeOS and Android (Windows and MacOS are already supported), and Windows OS metrics that are critical to troubleshooting device issues. ZDX also enhances networking capabilities with remote packet capture, ZPA web caching, and third-party proxy support to drive better visibility across the global enterprise.
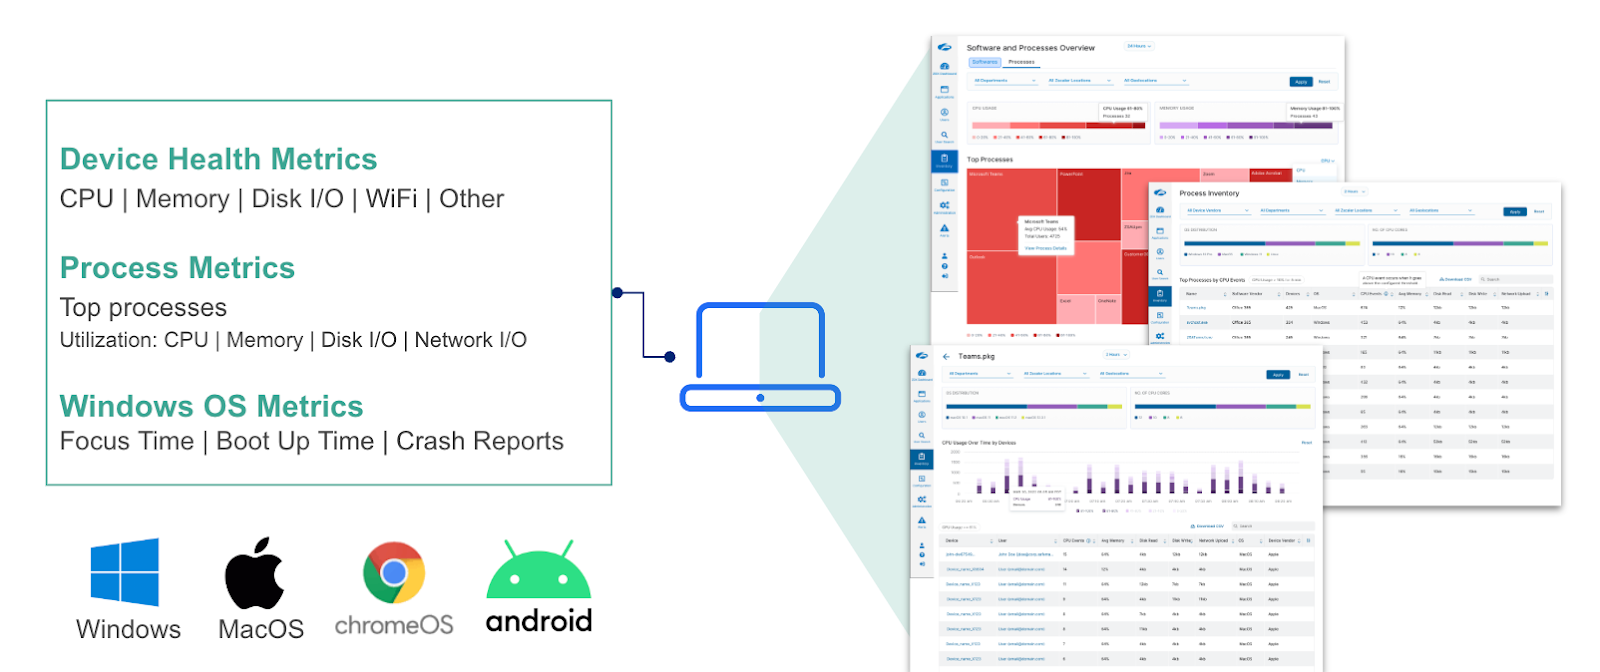
1. Get endpoint performance insights with detailed process level monitoring: With ZDX Advanced Plus you are now able to get time-series data about the top five processes which are consuming the device CPU, memory, disk IO and network IO. This powerful enhancement enables ITOps teams to quickly get to the offending process which could be negatively impacting the end user’s experience. Watch this video to see it in action!
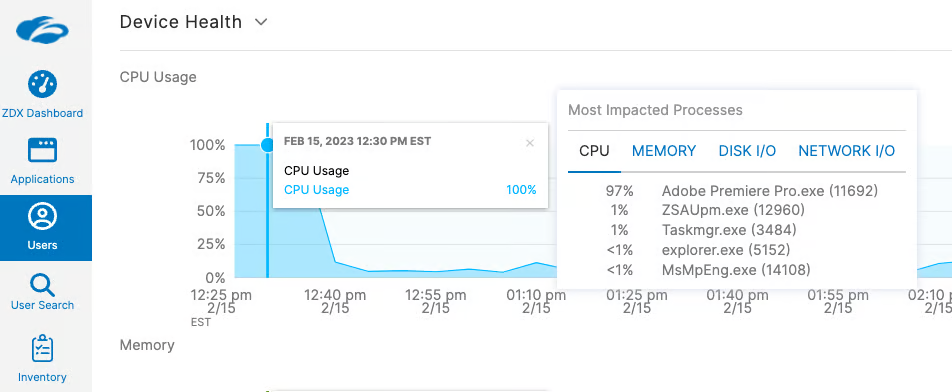
ZDX process level monitoring
2. Get deeper visibility into overall endpoints’ health: With our new Microsoft Endpoint Analytics integration, IT and service desk teams can identify issues with user software or devices that might be impacting performance and reliability. Metrics are garnered from the Microsoft Intune API and mapped to individual ZDX users and devices to provide Endpoint Analytics scores and data. Watch this video to see it in action!
The user details page provides the following endpoint analytics information for a specified user device:
- Endpoint analytics score: Reflects the weighted average of the Startup Performance score and Software Reliability score.
- Health status: Shows the most recent status of the device, designated as unknown, has insufficient data, needs attention, or is meeting goals.
- Last updated: Indicates the date and time when metrics were last collected from the Microsoft Intune API. Although data is collected from the API every three hours, metrics might not repopulate every three hours within the UI. Some Startup Performance events might take up to 24 hours to be displayed, and some Software Reliability events might take up to 3 days to be displayed.
- View endpoint analytics: Accesses scores and metrics for Startup Performance and Software Reliability.
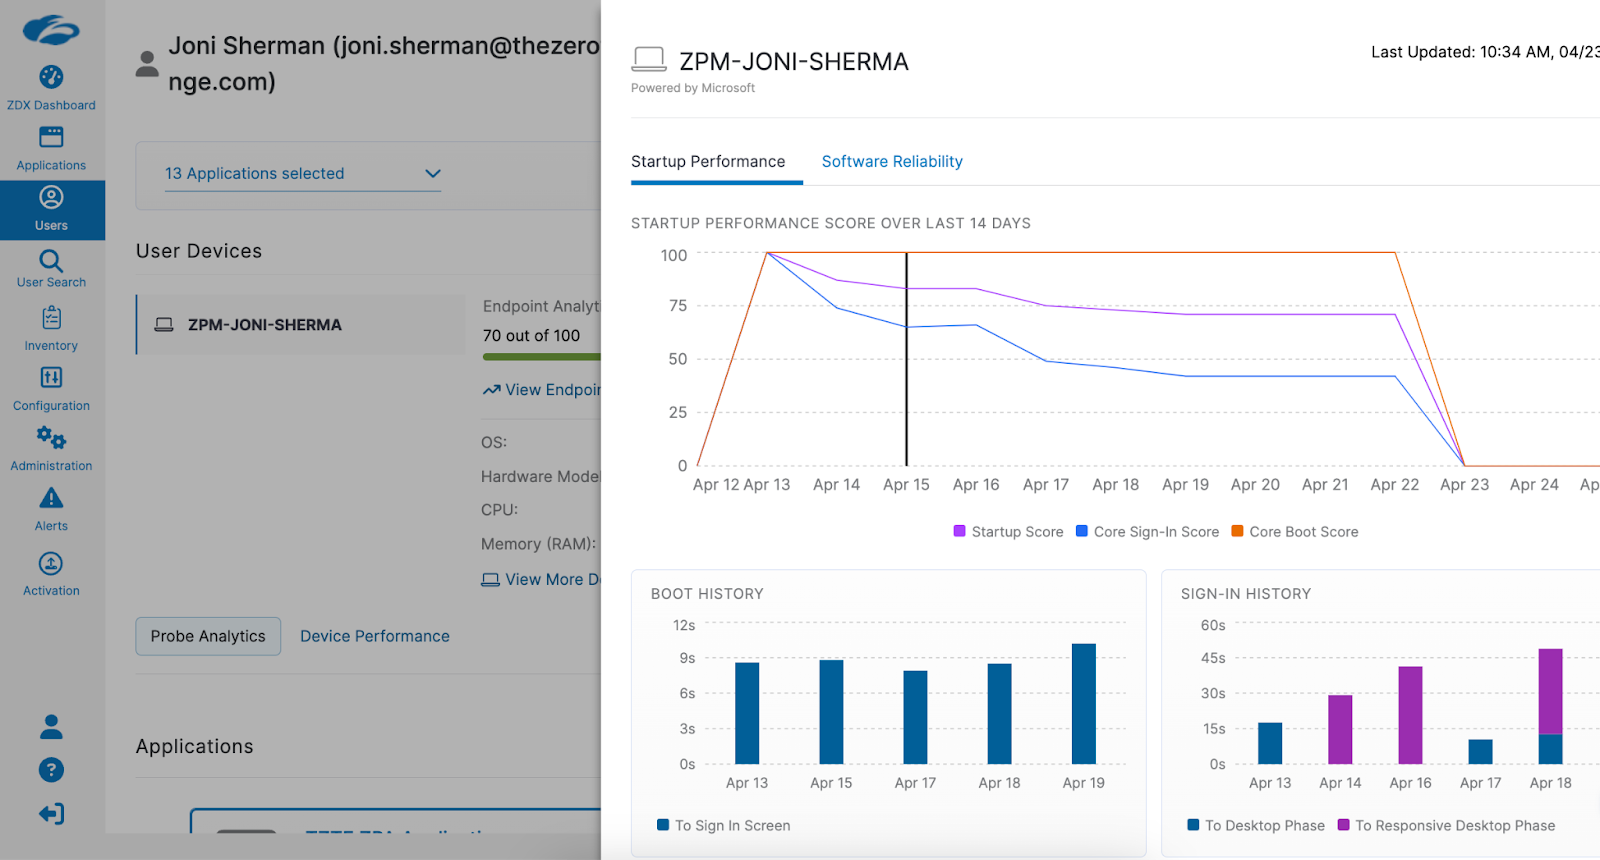
ZDX integrated with Microsoft Intune analytics
3. Capture packets for troubleshooting user issues on-demand: We introduced a new knob in Deep Tracing which enables Ops teams to launch on-demand packet captures without any end user intervention. Operations teams can now effortlessly launch packet capture on the user’s device without the need to manually install packet sniffing tools like Wireshark. Once the packet capture is complete, the location of the .pcap file is listed within the Deep Tracing Session results.
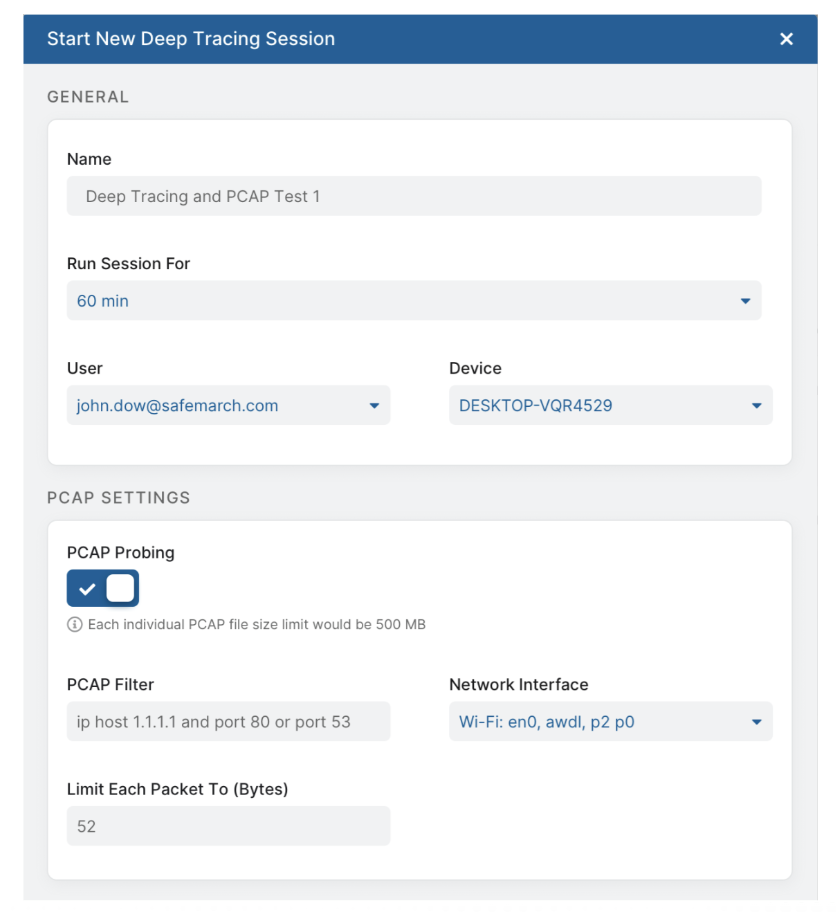
ZDX remote packet capture
4. Monitor private apps without causing impact: ZDX CloudPath now has support for caching probe data, so that we can continue to monitor their performance without negatively impacting them.
ZDX CloudPath with App Connector
5. Get end-to-end visibility when using third-party proxies: ZDX CloudPath is adding support for detecting traffic paths when it is traversing via your on-prem or cloud-based third-party proxy. This new capability for CloudPath will continue to evolve to add support for more complex customer networks.
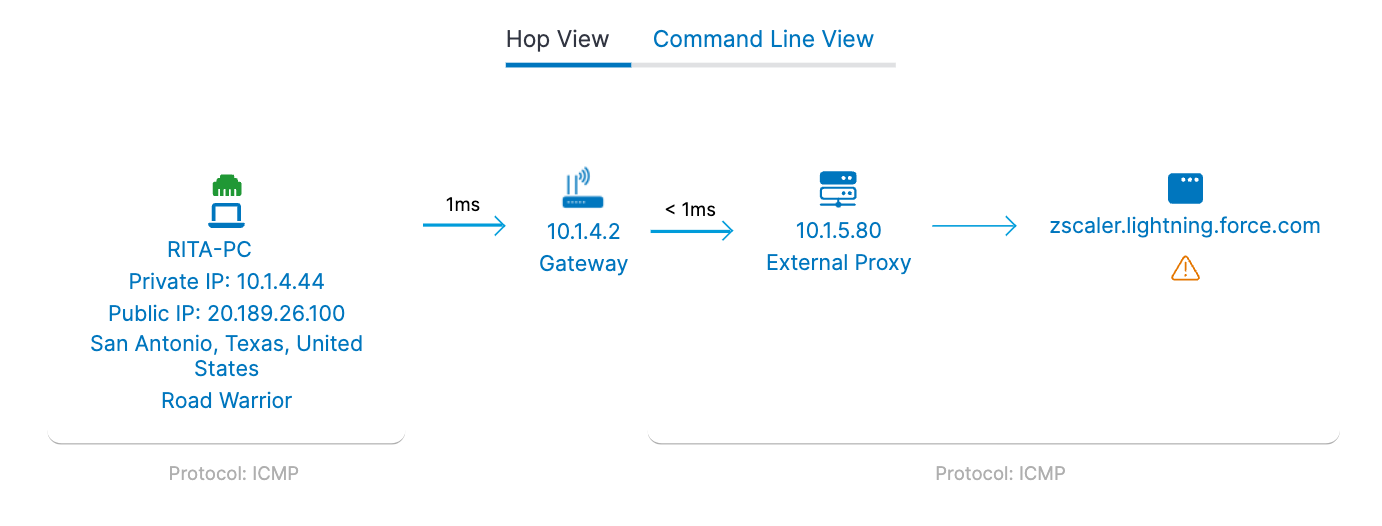
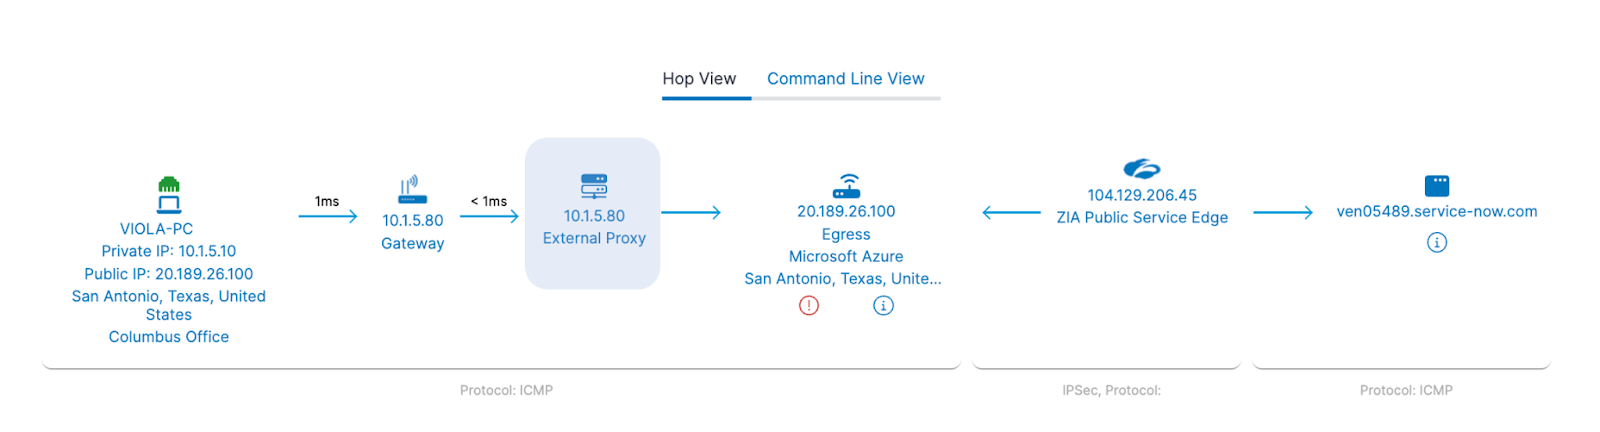
ZDX CloudPath with external proxy visibility
6. Support for ChromeOS devices: We now support ZDX on ChromeOS. This new platform provides end user experience visibility now for users of Chromebooks. Large school districts and customers who have been extensively using ChromeOS devices can get full visibility into end user experience.
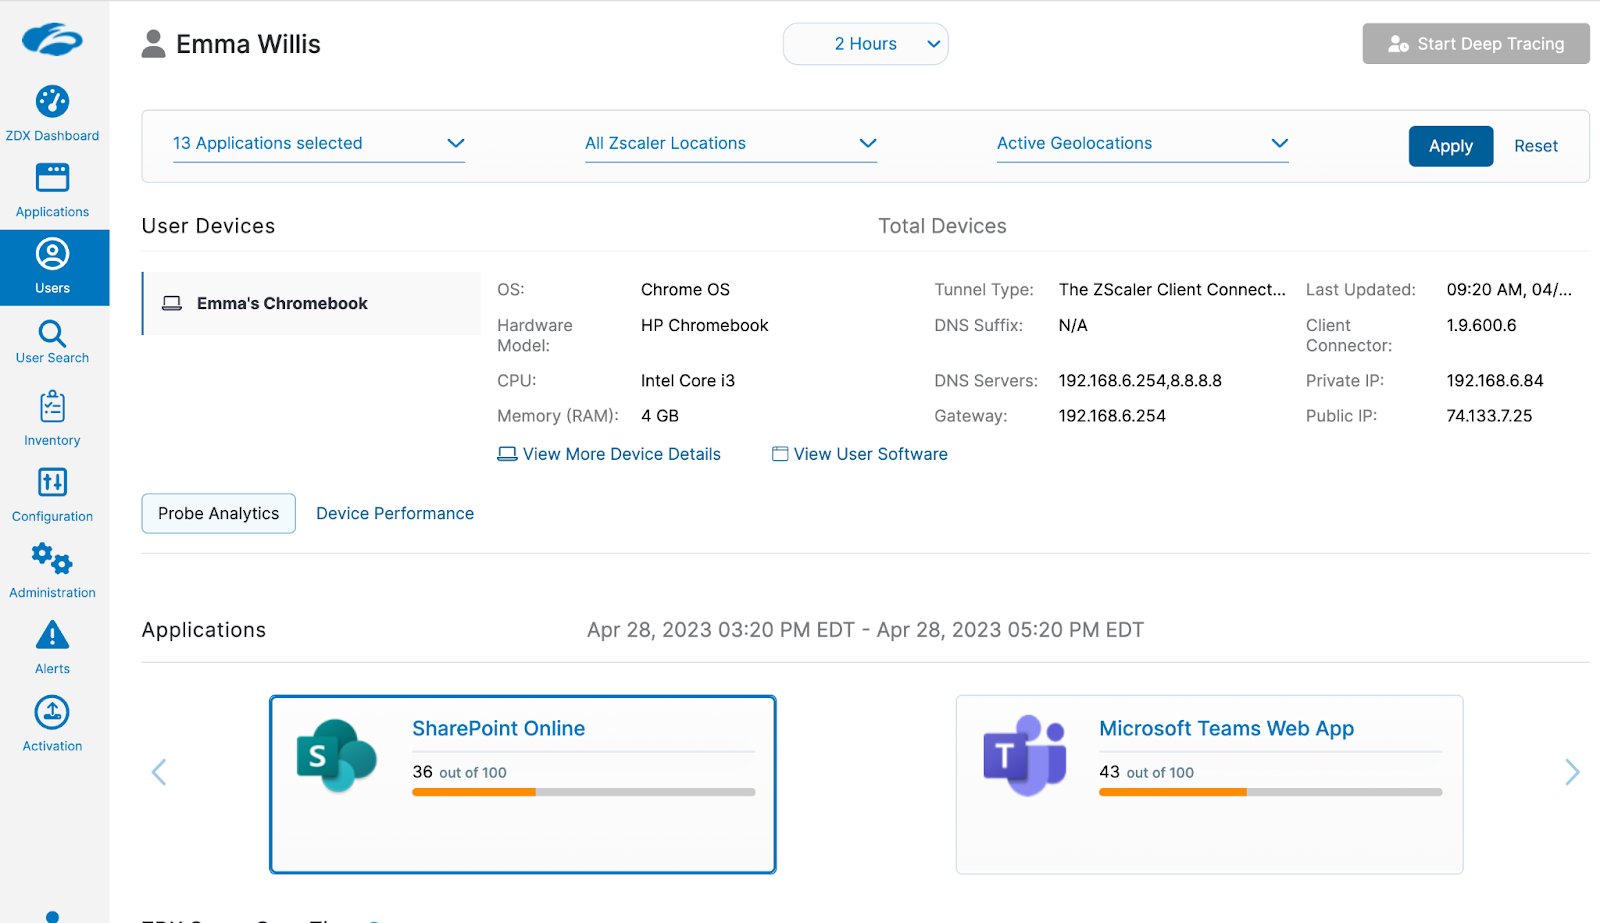
ZDX ChromeOS support
Solve issues faster with ZDX
With the groundbreaking innovations above, your business can now tackle today’s and tomorrow's user experience challenges with ease. With these enhancements, you can gain insights from your existing environment, achieve faster IT resolutions using AI, and scale your global enterprise to further enhance end user experience, no matter where they are located. To learn more about these innovations watch our webinar, sign up for a demo and review the latest features today!


